Chart of Accounts Explained for UK Waste Management
Learn how a chart of accounts works, from legal basics to a ready waste-management template, so your reporting, audits, and ESG data all line up.
In this article
- What a Chart of Accounts Actually Does
- The chart is the file plan
- Legal Purpose and Statutory Drivers
- Retention changes the design decision
- The Standard Account Numbering Scheme
- Read the trailing digits as a filing system
- Check the scheme before posting
- Common Schemes for UK Small Businesses
- Choose the smallest structure that works
- A Ready Waste and Recycling Template
- Keep the commercial question visible
- Mapping the Chart to FRS 102 and Tax Lines
- Build a crosswalk, not a memory test
- Adding Sites, Materials and Tonnes as Dimensions
- Why dimensions beat duplicate nominal accounts
- Maintaining and Optimising the Chart Over Time
Your finance team has the invoices. Operations has collection records. Site managers have weighbridge tickets. The sustainability lead has tonnage figures. Yet when someone asks how much each site spent on treatment, which material streams generated income, or whether the reported waste destinations reconcile to the ledger, the answer may still require several spreadsheets and a long chain of emails.
A well-designed chart of accounts gives those records a common structure. It tells people where each transaction belongs, how it should appear in management and statutory reporting, and which operational details must travel with it. For a UK waste or recycling business, that structure needs to do more than separate income, assets and expenses. It must also connect finance with sites, materials, destinations, contracts and tonnes.
What a Chart of Accounts Actually Does
A chart of accounts is the organised index that tells your accounting system how to classify every transaction in the general ledger. It isn't the ledger itself. The ledger holds the individual debits, credits, dates, suppliers, customers and values, while the chart provides the account names, codes and reporting categories that make those entries usable.
Consider a facilities team reconciling waste spend across several sites. One supplier invoice might include container hire, haulage, treatment and contamination charges. If every line is posted to a broad account called “waste disposal”, finance can confirm the total invoice value, but it can't easily explain which service drove the cost or compare treatment spend between sites.
The chart of accounts solves the classification problem at the point of entry. A transaction might be posted to a treatment-cost code, tagged to a site, linked to a customer contract, assigned to a material stream and matched with a weighbridge reference. The nominal code controls the financial statement category. The additional fields preserve the operational detail.
The chart is the file plan
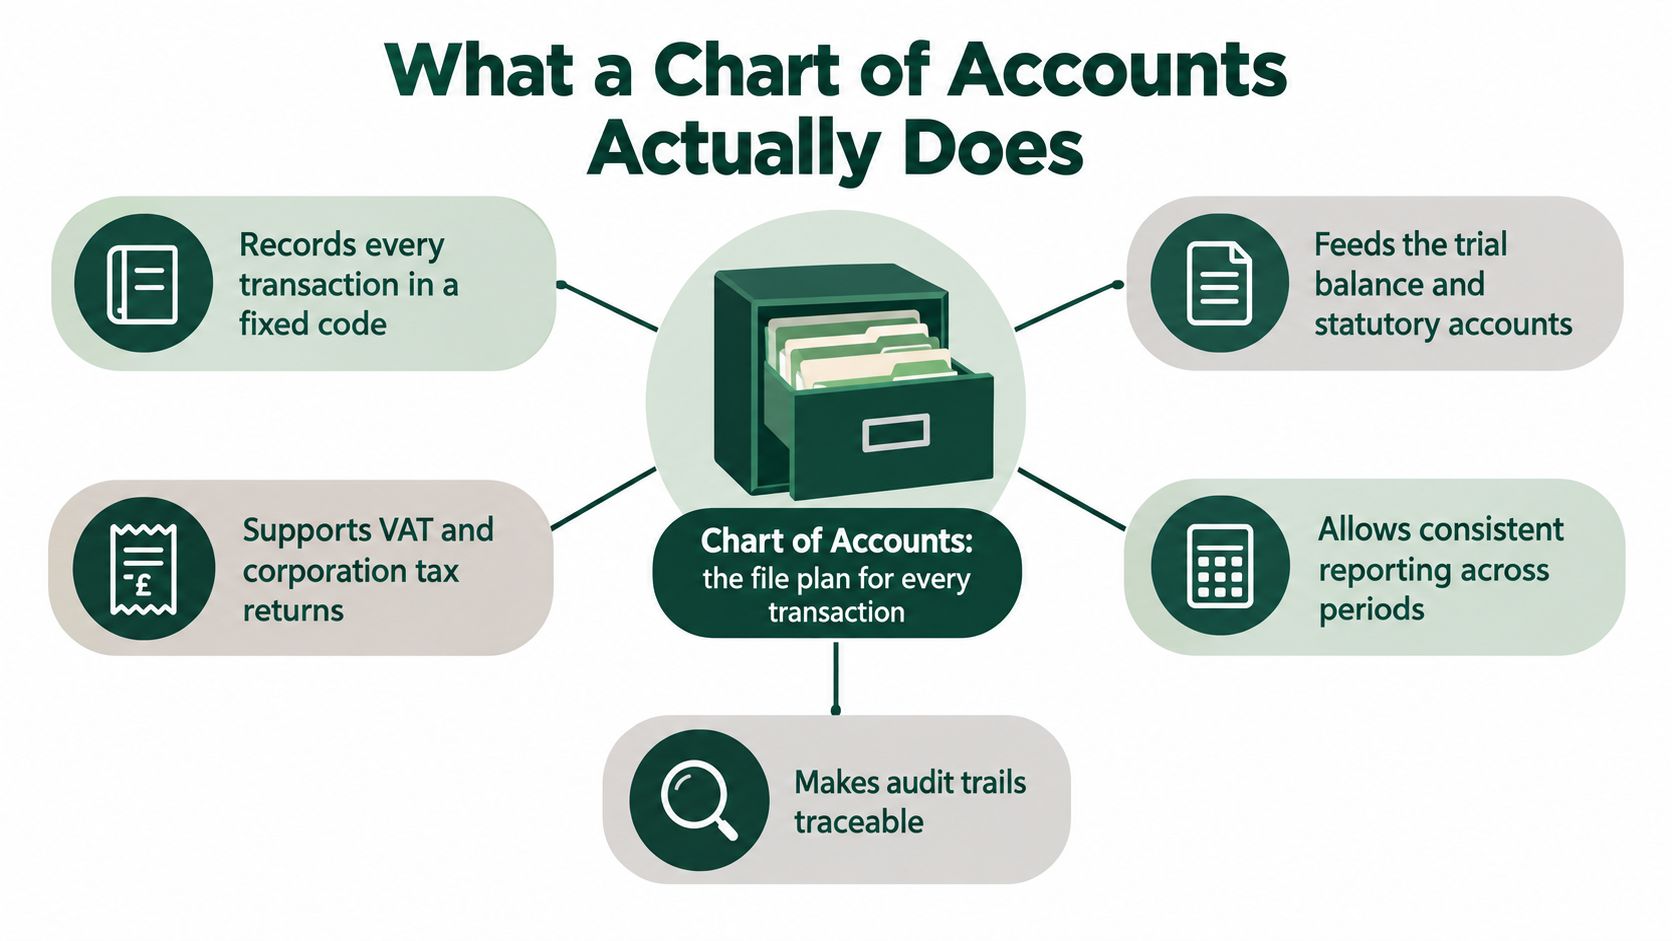
Think of the chart as a file plan for financial evidence. It answers five practical questions:
- What is this transaction? Income, treatment cost, equipment, payable or another category.
- Where does it appear? The balance sheet, profit and loss account, or a management report.
- How should similar transactions be treated? A consistent rule prevents one site from coding haulage as treatment while another codes it as general overhead.
- What detail should accompany it? Site, material, destination, carrier, contract or quantity.
- Can someone find the evidence later? A clear code and supporting reference make invoices, contracts and operational records easier to trace.
The numbering matters because it shapes every report produced afterwards. A code that separates hazardous-waste handling from ordinary treatment can support margin analysis today and provide a clean audit trail later. A vague code may force the finance team to reconstruct the distinction from supplier invoices, which is slower and more prone to inconsistent judgement.
Practical rule: Put detail into the chart only when it supports a report, control or decision. Put changing operational attributes into dimensions rather than creating a new nominal code for every variation.
The rest of the design follows that principle. Start with the legal record-keeping purpose, build a readable numbering scheme, add waste-specific accounts, then map those accounts to statutory lines and operational dimensions.
Legal Purpose and Statutory Drivers
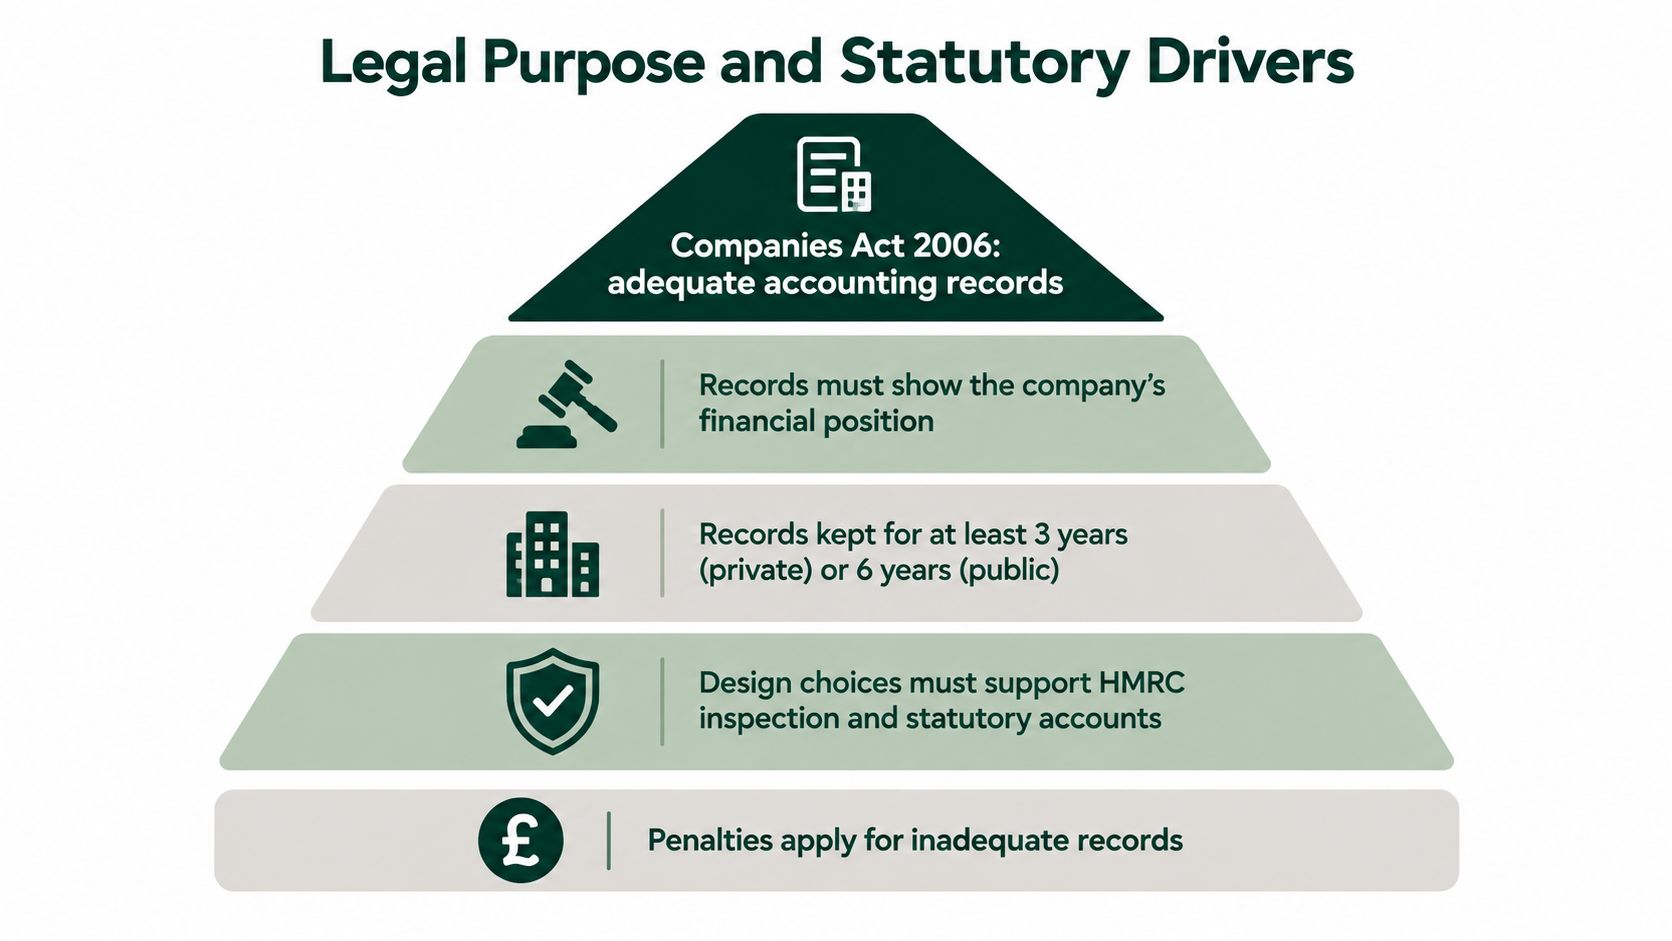
A recycling business may have invoices, weighbridge tickets and processor statements, yet still struggle to explain its accounts if those records are coded inconsistently. Section 386 of the Companies Act 2006 requires companies to keep accounting records that show and explain transactions, disclose the company's financial position with reasonable accuracy, and help directors ensure that statutory accounts comply with the Act. The records must cover money received and spent, the purpose of receipts and payments, assets, liabilities, and, where relevant, stock and sufficiently detailed buying and selling records. Section 386 of the Companies Act 2006 sets out this statutory requirement.
A chart of accounts is the organising layer behind that evidence. It gives each transaction a consistent place, so collection costs, processor charges, equipment purchases and disposal income do not blur into one undifferentiated total. For a waste operator, that structure also needs to preserve the business context: material stream, site, destination and tonnes can connect finance records with compliance and ESG reporting.
Retention changes the design decision
Retention rules make stable coding a control over several reporting cycles. Accounting records must be kept for three years for private companies and six years for public companies, and government guidance applies a six-year benchmark from the end of the relevant financial year. The records include evidence of money received and spent, assets, liabilities, stock, and goods bought or sold. The UK Government's guidance on company accounts explains the wider record-keeping expectation.
A code chosen today may determine whether someone can retrieve the supporting invoice, contract, weighbridge ticket or processor statement years later. Keep the account name stable, document the coding rule, and preserve the reference linking the entry to its evidence.
A statutory-focused design should:
- Separate capital and revenue items, so equipment purchases are not confused with operating costs.
- Group operating costs clearly, keeping treatment, haulage, collection and subcontractor charges identifiable.
- Preserve transaction-level references, including invoice numbers, contracts and operational records.
- Map each internal code to a reporting line, so the route from entry to statutory statement is documented.
Statutory accounts may present a concise line such as cost of sales or operating expenses. The chart should retain the detail supporting that line, while dimensions hold changing operational attributes such as site, material, destination and tonnes. This gives finance, compliance and ESG teams a shared data spine without creating a new nominal account for every operational variation.
The Standard Account Numbering Scheme
A practical UK chart of accounts often uses four- or five-digit nominal codes. The leading digit identifies the broad account family, while the remaining digits provide room for subcategories. This isn't a legally prescribed UK numbering system. It's a management convention that helps people read reports quickly and maintain a logical order.
A simple structure can begin like this:
- 1xxx for assets
- 2xxx for liabilities
- 3xxx for equity
- 4xxx for income
- 5xxx to 7xxx for costs and operating expenses
The first digit should answer the statement-classification question immediately. A code beginning with 5 should be a cost, not income. The later digits should explain the type of transaction without turning every supplier or site into its own nominal account.
| Code Range | Category | Typical Contents | Goes on |
|---|---|---|---|
| 1000–1999 | Assets | Bank, receivables, stock, equipment and prepayments | Balance sheet |
| 2000–2999 | Liabilities | Payables, loans, accruals and tax liabilities | Balance sheet |
| 3000–3999 | Equity | Share capital, reserves and retained earnings | Balance sheet |
| 4000–4999 | Income | Service income, commodity income and other operating income | Profit and loss |
| 5000–5999 | Direct costs | Collection, treatment, haulage and subcontractor costs | Profit and loss |
| 6000–6999 | Operating expenses | Administration, premises, sales and general overheads | Profit and loss |
| 7000–7999 | Other costs | Finance costs, exceptional items or other defined categories | Profit and loss |
Read the trailing digits as a filing system
Within the 5000 range, you might reserve 5100 for collection, 5200 for treatment, 5300 for haulage and 5400 for subcontractors. That approach groups transactions by economic purpose. It doesn't group them by department name, because a department can change while the underlying cost remains the same.
Leave gaps between related codes where possible. If 5200 represents treatment costs, nearby spaces can accommodate hazardous treatment, specialist processing or a new service line without forcing a complete renumbering. The exact numbers are examples, not a universal UK standard.
Check the scheme before posting
Run a simple review before activating the chart:
- Confirm that every code has one account type and one statement destination.
- Check that balance-sheet accounts aren't mixed with profit-and-loss accounts.
- Confirm that direct costs can be separated from overheads where management needs gross-margin analysis.
- Check that VAT treatment and tax reporting rules can be attached to the relevant codes.
- Confirm that the software's trial balance can roll every account into the intended report line.
The test is easy to state. If a colleague sees 5200 Treatment Costs, they should know what belongs there, what doesn't, and which report will use the balance.
Common Schemes for UK Small Businesses
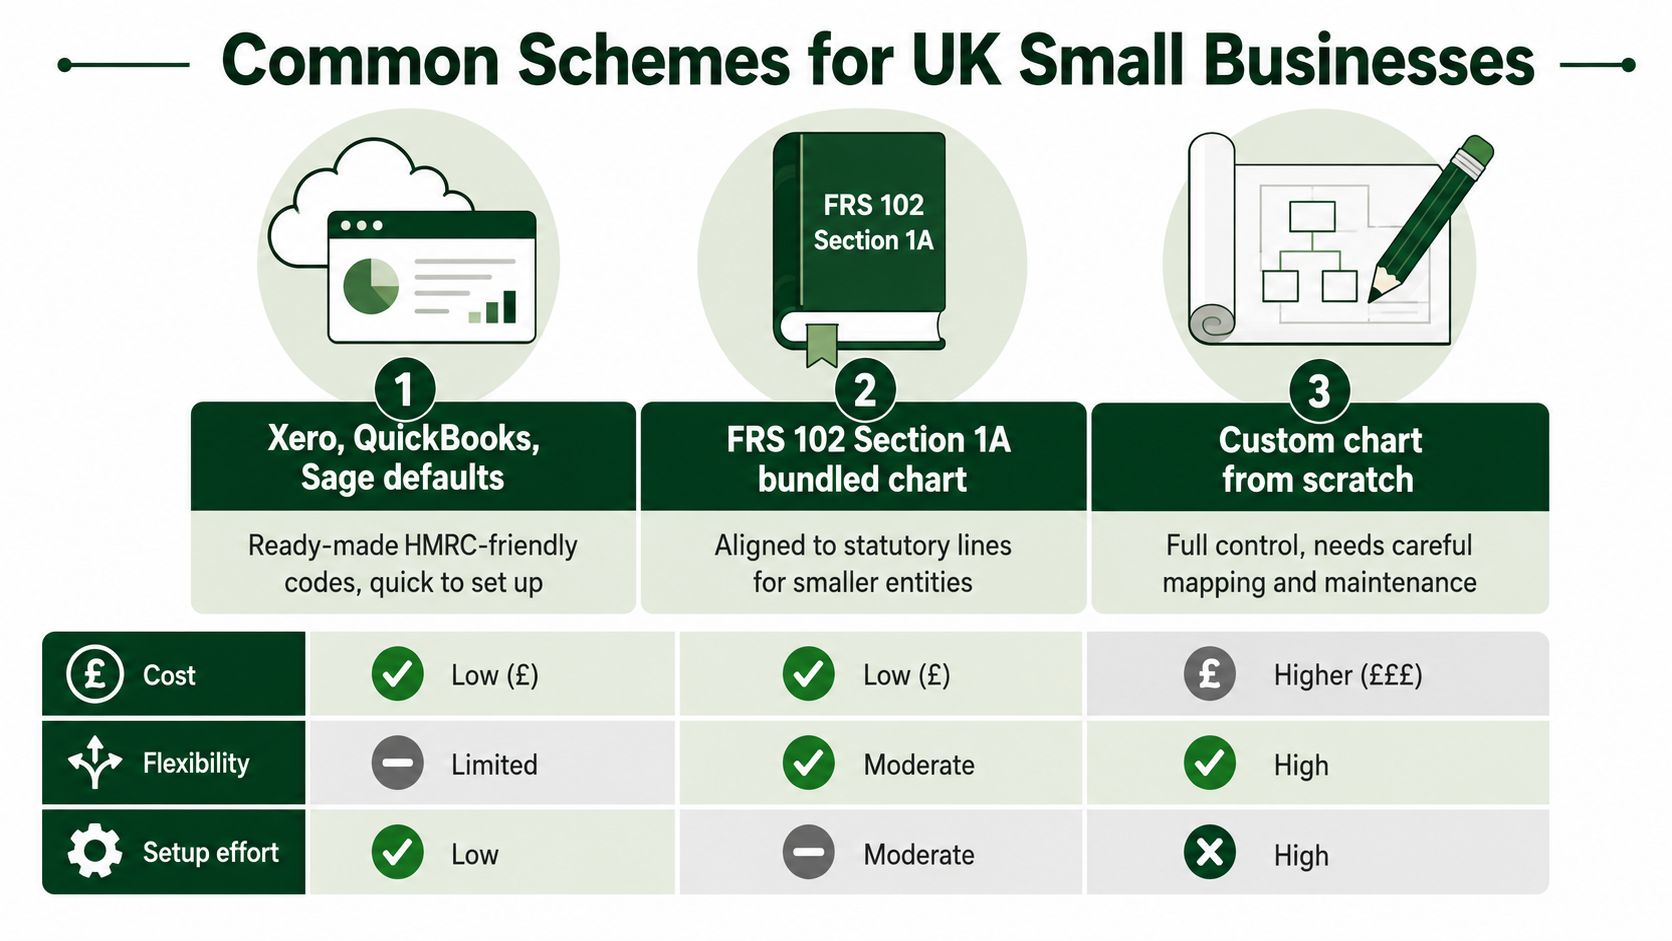
Most UK accounting software platforms provide a ready-made chart. Xero, QuickBooks and Sage can offer a quick starting point, with familiar account categories and reporting functions. That option usually suits a small operator whose requirements are limited to bookkeeping, VAT records, statutory accounts and straightforward management reporting.
A second approach is to build around the reporting lines associated with FRS 102 Section 1A or another applicable framework. This can make the year-end mapping process clearer, particularly where the finance team already works closely with an accountant. It still won't automatically provide the operational detail required for material, destination or site reporting.
The third option is a bespoke chart designed around the business model. A specialist structure can separate waste streams, service types, treatment costs, commodity income and hazardous services, but it needs governance. Without documented definitions and a reporting crosswalk, customisation can create more confusion than insight.
Choose the smallest structure that works
| Option | Strength | Limitation | Best fit |
|---|---|---|---|
| Software default | Fast setup and familiar reports | Often too broad for waste and ESG analysis | Single-site small business |
| Framework-oriented chart | Easier statutory roll-up | May lack site and material detail | Smaller company with formal year-end reporting |
| Bespoke sector chart | Strong operational and margin analysis | Requires ownership and maintenance | Multi-site or complex waste operator |
A default chart may record all waste spend under one expense heading. That can be acceptable for a small site with one service and limited reporting needs. It becomes restrictive when the business must distinguish collection from treatment, or when facilities managers need to compare costs and tonnages by location.
The best scheme isn't the longest one. It's the one that produces the required statutory, management and sustainability reports without forcing people to maintain duplicate codes. Use nominal accounts for stable financial categories, then use dimensions for the details that change frequently.
A Ready Waste and Recycling Template
A UK waste operator needs a chart that reflects how services are bought and delivered. The account names below provide a practical skeleton. They aren't a prescribed numbering system, so the codes can be adapted to match existing software, provided the reporting map remains clear.
| Code | Account Name | Used For | Type |
|---|---|---|---|
| 4100 | General waste service income | Charges for general waste services | Income |
| 4110 | Cardboard and paper income | Charges connected with cardboard and paper | Income |
| 4120 | Plastics recycling income | Plastics collection or processing income | Income |
| 4130 | Food waste income | Food waste and organic service income | Income |
| 4140 | Hazardous waste service income | Hazardous-waste handling and disposal services | Income |
| 4150 | Confidential destruction income | Secure destruction services | Income |
| 4160 | Equipment and container income | Equipment, container or related service income | Income |
| 4170 | Commodity income | Income from recyclable commodities | Income |
| 5100 | Collection costs | Collection charges paid to providers | Direct cost |
| 5110 | Haulage costs | Transport and route-related supplier charges | Direct cost |
| 5120 | Treatment and processing costs | Processor and treatment fees | Direct cost |
| 5130 | Disposal costs | Disposal charges, including landfill where applicable | Direct cost |
| 5140 | Hazardous-waste handling costs | Specialist handling, transport and disposal | Direct cost |
| 5150 | Subcontractor charges | External service providers | Direct cost |
| 5160 | Container hire | Hired containers and associated charges | Direct cost |
| 5170 | Contamination charges | Charges caused by contamination or rejected loads | Direct cost |
| 6100 | Waste equipment depreciation | Depreciation of owned waste equipment | Operating cost |
| 6110 | Equipment maintenance | Repairs and maintenance for balers, compactors and related equipment | Operating cost |
| 6120 | Compliance and environmental reporting | Defined compliance and reporting costs | Operating cost |
| 4180 | Commodity rebates and recoveries | Rebates or recoveries linked to waste streams | Income or contra-cost |
Keep the commercial question visible
Separate collection from haulage because the two costs answer different questions. Collection may reflect service frequency or container activity, while haulage can relate more closely to route design, distance or vehicle use. Posting both to a single waste account hides that distinction.
Treatment and disposal also deserve separate treatment. A processor fee, a landfill charge and a specialist hazardous service can have very different operational and commercial implications. Separate codes let managers investigate the reason for a variance without reading every invoice line.
Commodity income should remain visible rather than being netted invisibly into a general sales account. Rebates and recoveries can then be linked to the material stream that generated them, allowing the business to assess gross cost and net recovery value.
A useful boundary: The nominal code should describe the financial nature of the entry. The site, material, destination and quantity should normally be recorded as dimensions attached to that entry.
This template also supports a clear distinction between direct service costs and broader operating expenses. Whether a particular item belongs in cost of sales or overheads depends on the entity's accounting policy and reporting needs, but the decision should be documented and applied consistently.
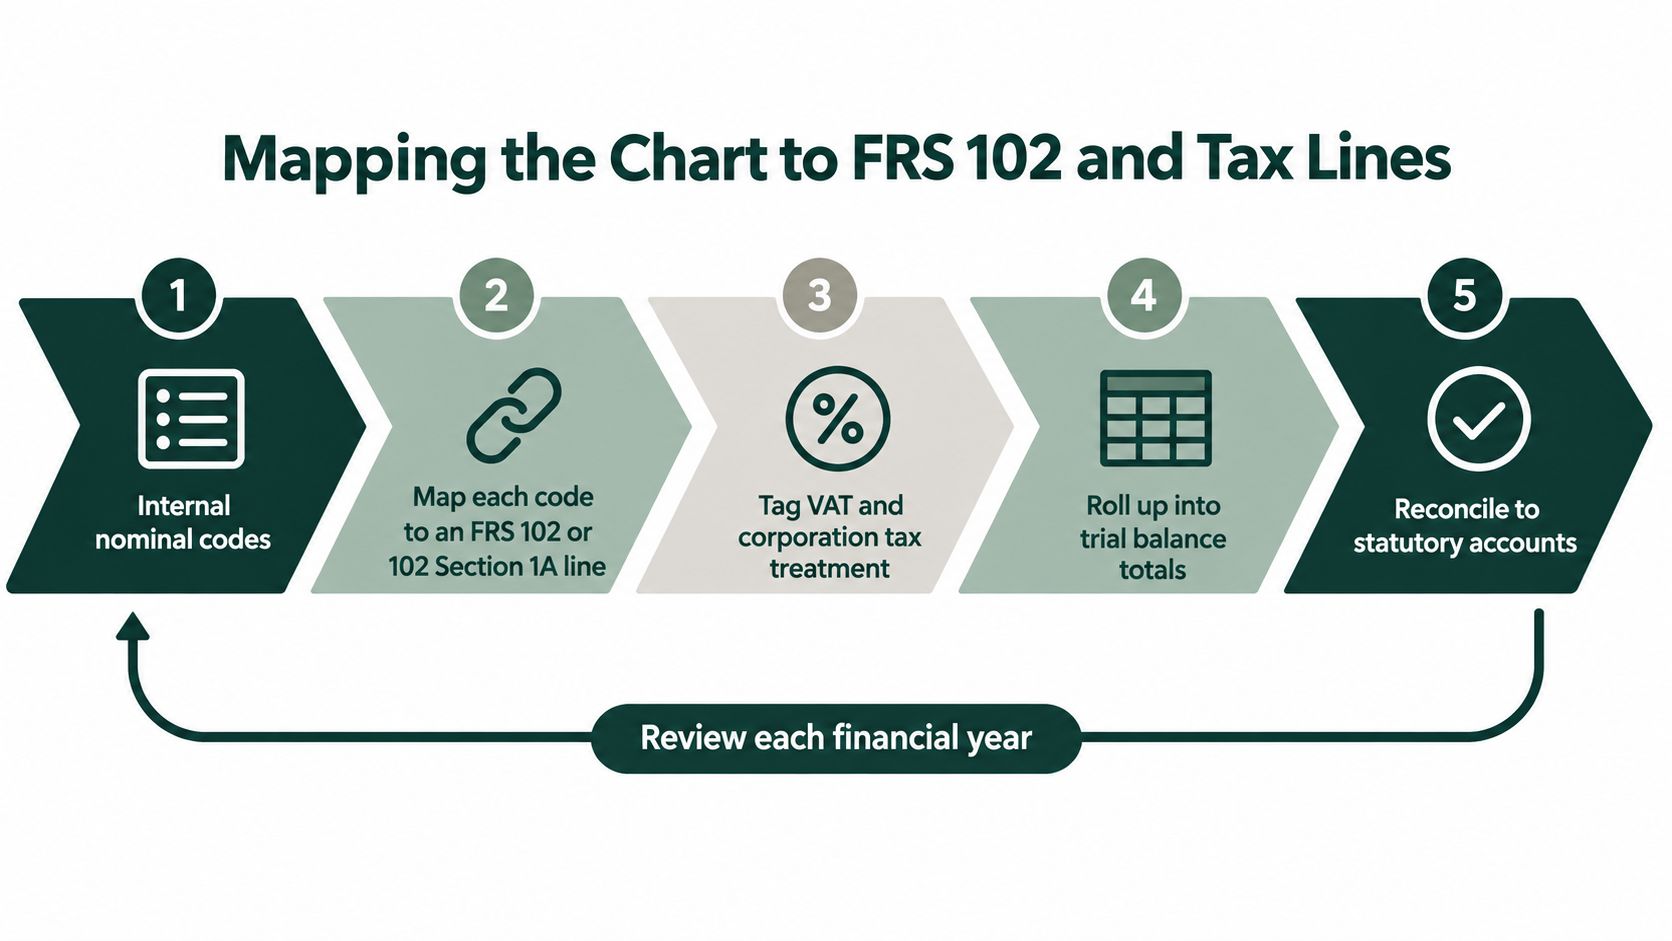
Mapping the Chart to FRS 102 and Tax Lines
A facilities manager may see three invoices for collection, treatment and hazardous-waste handling, while the statutory accounts show one operating-cost total. The chart must preserve the operational detail and provide a documented route to the applicable reporting framework. UK accounting is driven by the applicable framework, not by a particular code range. The chart should map to FRS 102, FRS 102 Section 1A, FRS 105 or IFRS. HMRC and Companies House outputs also depend on accurate classification, VAT treatment, period cut-off and reporting-line mapping. This UK overview of chart-of-accounts design explains why internal numbering matters less than a clear crosswalk.
Take three internal codes:
- 5100 Collection costs
- 5120 Treatment and processing costs
- 5140 Hazardous-waste handling costs
Management reporting can keep these accounts separate. The statutory mapping may place all three within a broader cost-of-sales or operating-cost line, depending on the company's accounting policy and applicable presentation requirements. The underlying detail remains available in the ledger, supporting reconciliations, audit evidence and the working papers behind the reported total. That connection matters when finance needs to explain a margin movement or show how waste activity reached the published accounts.
Build a crosswalk, not a memory test
A useful mapping file should contain:
| Internal field | Purpose |
|---|---|
| Nominal code and account name | Identifies the ledger category |
| Financial statement destination | Shows whether it feeds the balance sheet or profit and loss |
| FRS 102 or other framework line | Documents the statutory presentation |
| VAT treatment | Records the relevant VAT coding rule |
| Tax treatment | Flags ordinary, capital or potentially disallowable items for review |
| Sustainability category | Connects the cost or income to the relevant waste stream or destination |
| Owner and review date | Shows who maintains the mapping |
The FRC accounts taxonomy supports tagging accounts prepared under IFRS, FRS 101, FRS 102, FRS 102 Section 1A and FRS 105. The UK Government XBRL guidance provides related filing context. Internal labels such as “special uplift” can help an operations team, but they should sit alongside a clear accounting description and statutory crosswalk.
Review the mapping when the business adds a service line, changes its accounting policy or updates its reporting framework. A stable code may acquire a different reporting destination, but the change needs approval, documentation and an explanation of affected periods.
Adding Sites, Materials and Tonnes as Dimensions
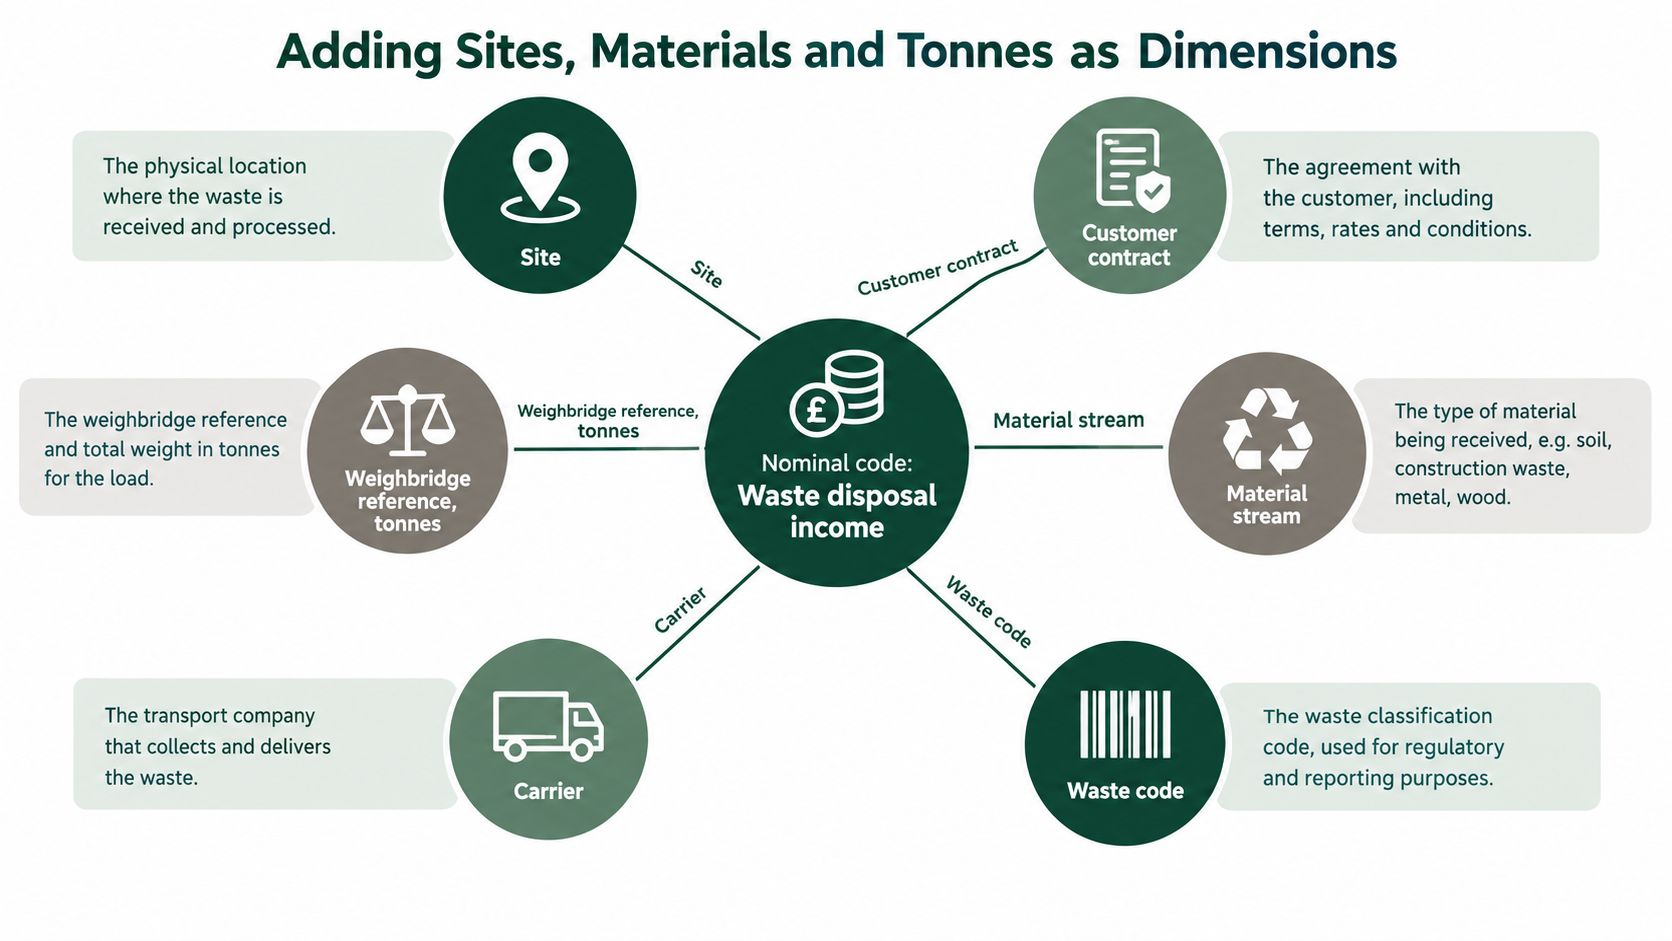
The most scalable design uses two layers. The nominal code answers what the transaction is. Dimensions answer where, for whom, from which material, to which destination and in what quantity it arose.
For example, a treatment invoice could use nominal code 5120 Treatment and processing costs, then carry the following fields:
- Site: The commercial location receiving the service.
- Customer contract: The agreement or internal cost centre.
- Material stream: Cardboard, paper, plastics, food waste, glass, wood or another defined stream.
- Waste code: The relevant operational or regulatory classification.
- Destination: Recycling, composting, anaerobic digestion, incineration with or without energy recovery, or landfill.
- Carrier: The transport provider.
- Weighbridge reference and tonnes: The operational evidence supporting the quantity.
Why dimensions beat duplicate nominal accounts
Creating separate nominal codes such as “Treatment, Birmingham, Plastics” and “Treatment, Leeds, Plastics” quickly produces a difficult chart. Every new site, material or destination multiplies the number of accounts, while the underlying financial category remains the same.
Dimensions preserve the reusable code and allow reports to filter or group the transactions. A facilities manager can view treatment cost by site. Finance can review gross margin by contract. Sustainability teams can reconcile tonnes by destination. The ledger remains compact because the changing attributes sit beside the nominal classification.
UK Government sustainability guidance expects waste reporting in metric tonnes by destination, including recycling, composting or food waste, anaerobic digestion, incineration with and without energy recovery, and landfill, alongside associated costs. The sustainability reporting guidance for 2025 to 2026 also supports separating hazardous-waste costs where possible and considering income from particular waste streams against related costs.
That makes the quantity field important. A value-only invoice can show what the business paid, but it can't by itself support cost-per-tonne or a reconciliation to a processor record. Retain the weighbridge, transfer-note or processor reference with the transaction so the financial value and operational quantity can be traced together.
The practical outcome: One coded transaction can support the ledger, a site-cost report, a customer-margin view and a waste-destination disclosure without creating four separate accounting entries.
Maintaining and Optimising the Chart Over Time
A chart of accounts needs an owner. Assign responsibility to a finance lead or controller who approves new codes, maintains the mapping file and checks that software changes haven't altered the reporting structure.
Review the chart at least as part of the annual accounts process and whenever the business adds a service line, site or legal entity. Retire unused codes through a controlled process rather than deleting historical evidence. Keep the old code inactive, record its replacement where relevant, and preserve the prior reporting map.
Use a simple change rule:
- New code: Written reason, owner and intended report.
- Renamed code: Impact assessment for historical comparisons.
- Retired code: Effective date and replacement treatment.
- New dimension: Definition, allowed values and data owner.
- Annual review: Check statutory mapping, VAT treatment and sustainability categories.
Software such as Xero, Sage and QuickBooks can make posting easier, but it won't decide whether treatment belongs in cost of sales or overheads, or whether a tonnage field reconciles to a processor record. Those are accounting and operational design decisions. Keep the chart stable, document exceptions and make every new code earn its place.
Gegan helps UK organisations connect waste services with clearer cost, material and destination data across single and multi-site operations. Visit Gegan to discuss a compliant waste and recycling structure that gives your finance and facilities teams more traceable reporting.