Define Quantitative Research: A Practical Guide
Define quantitative research and learn how to apply its methods to your operations, from surveys to statistical analysis, with practical examples.

In this article
- What Quantitative Research Actually Means
- Why the definition matters in operations
- The Core Characteristics That Define the Approach
- Structured numbers, not loose impressions
- Measures decided before the data arrives
- Analysis that does more than summarise
- Results that can travel beyond one site
- Common Methods Used in Quantitative Research
- The main methods you'll see
- A Worked Example From Waste and Operations
- Start with the outcome and the population
- Decide what gets measured and how
- Read the result properly
- Strengths and Limitations in Plain Language
- Where it is strongest
- Where it can fail
- How to Apply the Approach in a Real Waste or Operations Project
- Bringing It All Together for Better Decisions
Quantitative research is a systematic approach that collects numerical data and analyses it with statistical methods. If you're looking at contamination rates across sites, it's the difference between saying a new DMR sort "feels better" and showing whether the numbers moved.
You're probably staring at a spreadsheet, a site report, or a handful of weighbridge totals and asking a familiar question, did the change work or not? That's the point where quantitative research becomes useful, because it turns operational measurements into evidence you can defend in front of a client, an auditor, or your own management team.
What Quantitative Research Actually Means
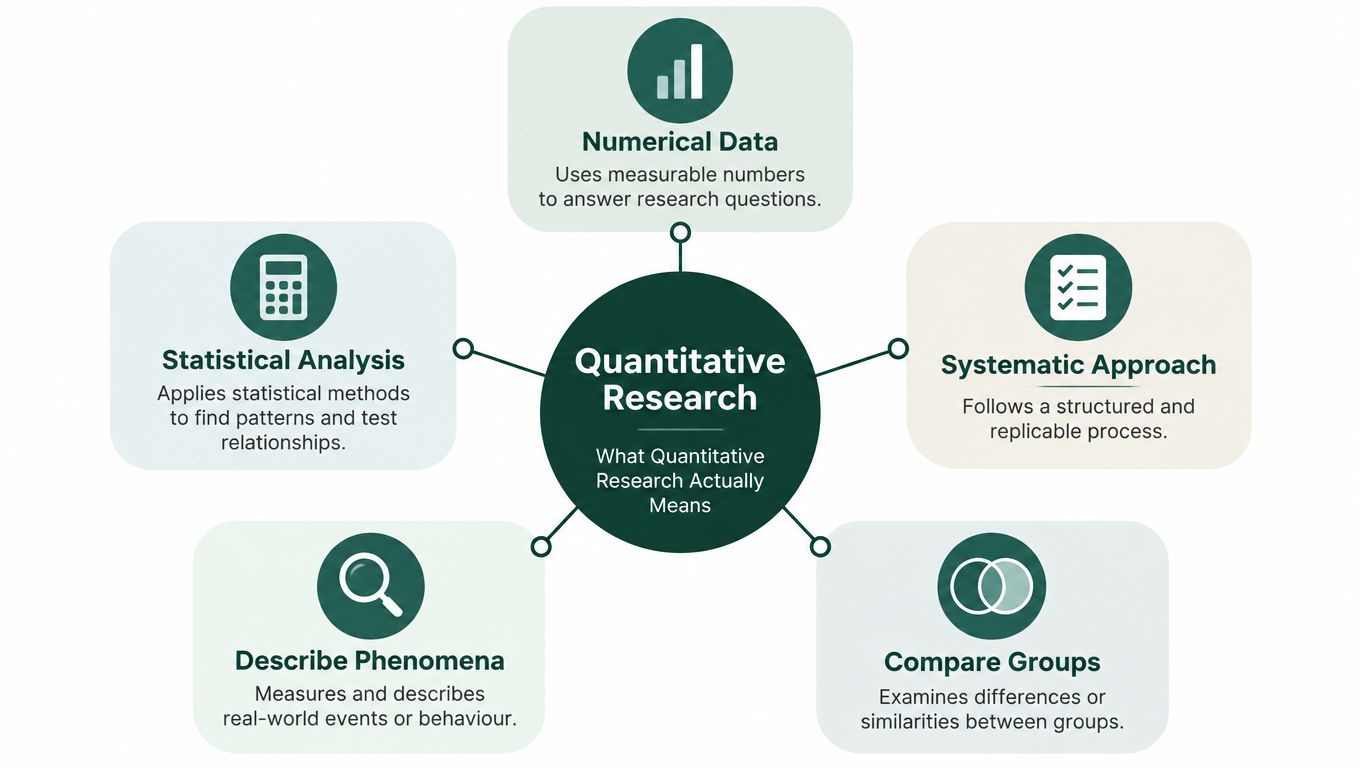
A facilities manager watching contamination rise across several sites needs more than a hunch about why it happened. Quantitative research is the method that turns that kind of question into a measurable one, using structured numerical data and statistical analysis to show what is happening, whether groups differ, or whether a change made a real difference. The UK guidance describes it as suitable for questions about how many people hold a view, whether service use varies by age or gender, and what changes follow an intervention, with structured data collection and pre-specified measures at the core (UK research guidance on quantitative methods).
In a waste setting, that might mean checking whether a new sorting protocol is reducing contamination across multiple sites. Eyeballing bins or relying on staff impressions will not give a clean answer, because workload, shift patterns, and memory can all distort what people think they saw. Weighing waste, recording counts, and comparing contamination percentages gives the team evidence they can inspect.
Why the definition matters in operations
The word systematic matters because it means the measurement process is set up before the results appear. That gives you a method that can be repeated, checked, and challenged later.
If a team cannot say what was measured, when it was measured, and how the figures were analysed, the project is still a tally, not a proper quantitative study.
A count of complaints on its own is just a list. A count with a defined sample, a fixed measure, and a statistical comparison becomes evidence a manager can defend in front of a client, an auditor, or the internal operations team.
The same preference for operational clarity runs through the Gegan team page, which is worth a skim before you design your own measures.
Quantitative research, then, is the use of structured numerical data and statistical methods to answer a defined question in a way others can inspect, repeat, and question.
The Core Characteristics That Define the Approach
A facilities team can collect plenty of figures and still miss the point. Quantitative work becomes credible when the numbers are set up before anyone starts drawing conclusions, so the measurement can be checked instead of accepted.
Structured numbers, not loose impressions
The first marker is structured numerical data. In waste operations, that means contamination is recorded as a percentage or a count in a fixed category, not as “pretty good” or “better than last month”. If the unit is clear, another person can inspect the figure later and understand exactly what it means.
Measures decided before the data arrives
The second marker is pre-specified measurement. Decide in advance that recycling rate will be measured in kilograms per site per week, or that residual waste will be tracked per collection route. If the measure is chosen after the result appears, the question can drift to fit the answer, and the exercise loses credibility.
Analysis that does more than summarise
The third marker is statistical analysis. That might be a simple average, a comparison between two sites, or a regression that checks whether a trend still holds when site size and seasonality are taken into account. UK guidance notes that quantitative studies can produce descriptive results, such as percentages and averages, and inferential results, such as correlations, t-tests, regression estimates, and significance tests (UK quantitative methods guidance).
Results that can travel beyond one site
The fourth marker is a focus on generalisable results. The sample and measurement process need to support defensible generalisation beyond the participants studied. In operations, that matters because one strong site does not prove a method will work everywhere.
A simple check helps here. If a project has numbers, but no fixed definitions, no pre-set outcome, and no analysis plan, it is reporting with decimals, nothing more.
Common Methods Used in Quantitative Research
A facilities manager trying to cut contamination, track missed collections, or compare routes needs more than a label like “quantitative.” The method has to fit the question. UK evaluation guidance points to surveys, questionnaires, and administrative records as common quantitative sources, with results then examined through measures such as means, regression, and ANOVA (UK evaluation methods guidance).
The main methods you'll see
A site team might use each one for a different operational job:
- Structured surveys and questionnaires: Ask every site manager the same questions in the same order, then compare scores or counts across sites.
- Controlled experiments and quasi-experiments: Change bin signage on some routes or sites, then compare contamination before and after the change.
- Structured observation with numeric coding: Watch sorting behaviour and record how often specific actions happen, instead of writing free-form notes.
- Administrative and operational datasets: Use weighbridge logs, collection records, or service reports already produced by the business.
The method should match the operational question. If the question is “how many,” a survey or record review may be enough. If the question is “did this intervention change behaviour,” the design needs a comparison across time, sites, or both.
For most waste trials, a spreadsheet with a t-test function is enough. Reach for more advanced tools only when you are comparing several variables across many sites and need a fuller regression analysis.

A good check is to ask what the data already exist for. If the business already records collection weights every week, that source may be more reliable than asking people to remember what happened months ago. If no record exists, a structured survey or observation plan may be the better fit.
A Worked Example From Waste and Operations
A multi-site customer wants to know whether a new DMR sorting protocol reduces contamination. That sounds straightforward, but it only becomes measurable when the outcome, the sites, and the comparison method are fixed in advance.
Start with the outcome and the population
Start with contamination percentage as the outcome. Then define the population, which might be all sites in a given sector and size band, so the result speaks to the right group rather than whichever locations were easiest to visit. A clear population keeps the project from drifting into anecdote.
The next step is the hypothesis. In plain language, the new protocol should lower contamination compared with the baseline. That does not need academic language, it just needs the expected direction to be visible before the data are collected.
Decide what gets measured and how
A solid design sets the sampling frame, measurement protocol, primary outcome, and statistical test before the first count is taken. That discipline keeps the analysis from shifting after the numbers come in.
Measure first, then compare. If the comparison comes first, the measurement will usually follow the conclusion you wanted.
For a DMR change, descriptive statistics give the average contamination level and the range across sites. That matters because one site can improve while another gets worse, and a single headline figure can hide that spread. Inferential analysis then asks whether the observed difference is likely to be real rather than noise, often with a t-test or a regression model, depending on the setup.
Read the result properly
The result needs a number, not just a direction. Say baseline contamination averaged 9% across 14 sites and fell to 6% after the protocol change. A t-test with a confidence interval helps show whether that 3-point drop is likely to be a real operational change or just random variation.
Reporting the sample base, often written as n, alongside percentages and visual results makes the finding easier to judge. In practice, that means the report says more than “contamination fell”. It says by how much, in what sample, and how much uncertainty remains.
That distinction matters. A result without uncertainty can look more certain than it is, especially when the number of sites is small or the sites differ in ways that affect the outcome.
Strengths and Limitations in Plain Language
A facilities team can use quantitative research to compare waste routes, track contamination, or test whether a new bin layout changed behaviour. It works best when the question is about measurable change, side-by-side comparison, or evidence that can stand up to scrutiny.
Where it is strongest
Its main strength is defensibility. Auditable recycling figures, contamination percentages, and collection-cost trends are easier to discuss with finance, compliance, and ESG teams when the measurement process is clear. The method also supports comparisons across sites, which helps a facilities lead see which location is performing better for a specific measure.
It is also useful for checking whether an intervention made a difference. If bin signage, staff training, or route changes are introduced, quantitative measurement can show whether the operational outcome moved in the expected direction. That is more dependable than relying on informal feedback from one supervisor, because the comparison is anchored in recorded data.
Where it can fail
Numbers can flatten context. A customer satisfaction score may show a pattern, but it stays silent on whether bin placement, staff turnover, or collection timing caused it. The score still has value, because it points to where to look next, yet it does not explain the reason by itself.
A poorly designed survey can also produce confident-looking nonsense. If the questions are unclear, the sample is biased, or the measurement changes halfway through, the result may look precise while describing the wrong thing. Guidance on sample design and weighting exists for exactly that reason, because representativeness and standardisation are part of the measurement, not an extra layer added at the end.
| Strength | Operational benefit | Limitation | Operational risk |
|---|---|---|---|
| Comparable numbers | Easier benchmarking across sites | Context gets compressed | Local problems can be missed |
| Statistical testing | Helps separate signal from noise | Small effects can look important | Teams may overreact to trivial change |
| Standardised measures | Supports audits and ESG reporting | Bad measures stay bad at scale | Wrong definitions spread quickly |
The hardest mistake is treating statistical significance as the same thing as business importance. A tiny change can be detectable in a large dataset and still not matter operationally. The right reading pairs the size of the effect with the uncertainty around it, so the team can judge whether the change is meaningful for the operation.
How to Apply the Approach in a Real Waste or Operations Project
A waste project starts with a simple operational question, then turns that question into measurement you can defend. If the team cannot say what changed, what was measured, and how uncertainty was handled, the report is only a dashboard.
A workable sequence helps keep the work grounded.
- Write a clear question: State exactly what you want to know, such as whether contamination fell after a protocol change.
- Pick a measurable variable: Choose something concrete, like kilograms of residual waste per site, recycling rate, contamination percentage, collection cost per tonne, or carbon emissions per collection.
- Decide the data source: Use weighbridge records, sensor logs, manual counts, or other operational records that can be checked later.
- Calculate the sample size or coverage: credibility comes from sampling design and statistical power, and a small but well-powered trial beats a large pile of unstructured data.
- Collect data consistently: Keep the definition, timing, and method stable across sites and over time.
- Analyse and report: Compare groups, calculate the effect estimate, include the confidence interval, and explain any missing-data treatment.
A practical internal reference for structured operational reporting is the chart of accounts. It shows why clean category design matters before analysis begins, because the same discipline that keeps financial lines tidy also keeps waste categories usable.
Sample size work should match the primary outcome, expected effect size, outcome variability, significance level, desired power, and study design. UK guidance on sample size notes that 80% power is commonly recommended, and higher power can be sensible when missing a real effect would be costly, as outlined in UK sample size guidance. In facilities work, that distinction matters. An underpowered evaluation can miss a genuine improvement, while an oversized one can make tiny, commercially irrelevant changes look more important than they are.
Consistency is what makes the numbers trustworthy. If measurement definitions stay fixed across sites and over time, the comparison stays fair. If they drift, the analysis starts mixing unlike with unlike, and the result quickly loses value.
Bringing It All Together for Better Decisions
Quantitative research is the structured way to turn operational measurements into defensible evidence about whether a change worked, a target was met, or a supplier is delivering. It helps a facilities manager move from impression to proof, as long as the numbers are defined before collection starts and reported with their uncertainty.
Three habits make the approach work in practice. First, define the variable before the data. Second, report uncertainty instead of hiding it. Third, choose the method after the question, not before. A project that follows those habits is much easier to defend in a review, a board meeting, or an ESG discussion.
The common traps are easy to spot once you know them. Chasing statistical significance without asking whether the result matters is one. Trusting a single percentage without knowing the sample behind it is another. So is using numbers as decoration when the actual question was never measured properly.
For more context on the organisation behind this guide, the Gegan website gives a wider view of how evidence-led waste management supports better operational decisions.
If you want cleaner data, clearer reporting, and waste metrics you can trust, Gegan can help you build that measurement discipline into day-to-day operations. Visit Gegan to see how a data-led waste programme can support better decisions, stronger reporting, and simpler management across your sites.