The Three Gorges Dam Explained: Power, Costs and Lessons
The Three Gorges Dam explained: its size, hydropower output, resettlement, ecological impacts and what it teaches about sustainable infrastructure.
In this article
- The Three Gorges Dam at a Glance
- Which number answers which question
- Why China Built It and How Long It Took
- A programme, not a single pour
- How One Dam Balances Flood, Shipping and Power
- Three jobs, one pool
- How Much Power the Dam Really Delivers
- Why the gap is so wide
- The Resettlement of More Than a Million People
- What a move actually removes
- Two readings of the same move
- Sediment, Fish and Groundwater Losses Downstream
- From a trapped load to a scoured channel
- A steadier river is not automatically healthier
- Economic and Geopolitical Stakes Beyond the Grid
- What the carbon figure does not cover
- A method that does not pretend the units match
- Check These Risks Before Backing a Similar Dam
- The three risks that decide the verdict
- Five questions for any proposal
More than 1.3 million people were moved for a reservoir, which is the fact that stops the Three Gorges Dam being only a power story. A BBC technical briefing records a concrete wall about 175 metres high and 2,335 metres long, holding about 39.3 billion cubic metres over roughly 1,084 square kilometres, with generating capacity reported at about 18 gigawatts around completion. That is a flood store, a shipping stair and a forced migration at the scale of a major UK city, built on one river.
The useful way to read it is as a sediment, water and social system that also makes electricity. Turbines are the visible output. What the reservoir traps, what it releases, and who had to leave decide whether the project looks wise after the concrete is finished. The picture below starts with size, then the decades of argument, then the daily split between floods, ships and power, and finally the measured losses downstream.
The Three Gorges Dam at a Glance
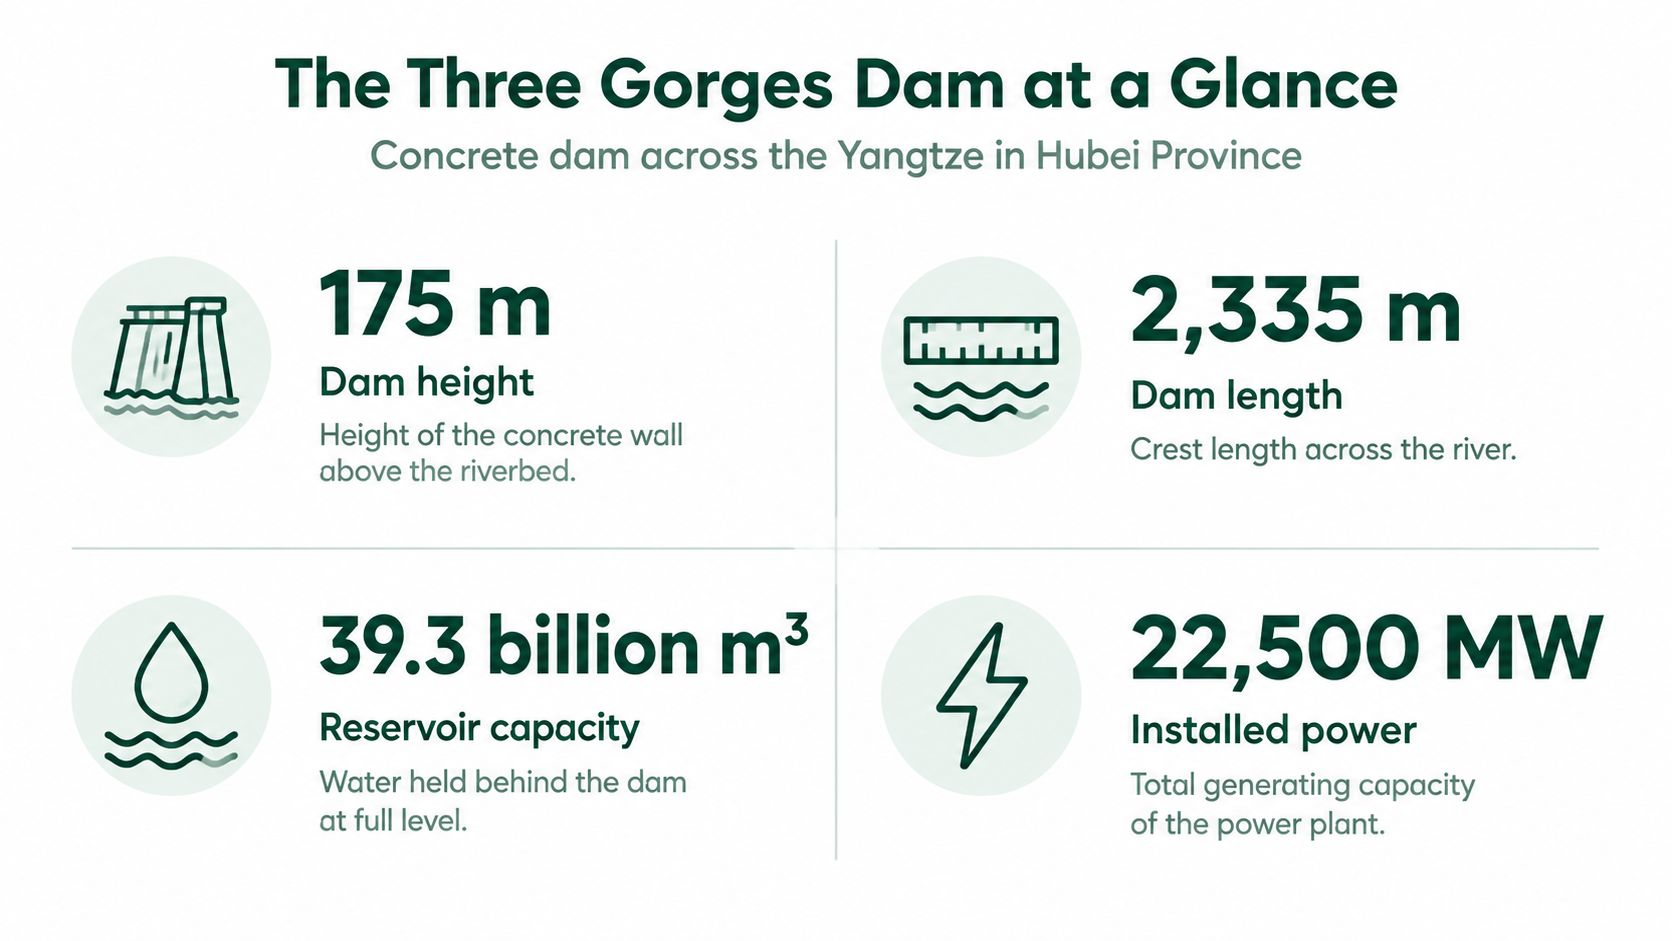
The dam's headline figures measure different parts of the system. Height and crest length describe the concrete wall. Reservoir volume measures the water held behind it, while surface area shows how much land the reservoir covers. Generating capacity describes the plant's potential output, not its actual production at every moment. The relocation count records a separate human cost.
| Specification | Figure | What it means |
|---|---|---|
| Dam height | About 175 m | Height of the concrete main dam wall |
| Crest length | 2,335 m | Length of the dam across the river |
| Reservoir capacity | About 39.3 billion m³ | Water volume held in the reservoir |
| Reservoir area | About 1,084 km² | Surface area covered by the reservoir |
| Generating capacity at completion | About 18 GW | Figure reported around the 2006 completion |
| Installed generating capacity today | 22.5 GW | Figure used in current sources |
| Largest vessel through ship locks | 10,000 tonnes | Limit for the five-tier ship lock system |
| People relocated | More than 1.3 million | One of the largest resettlements linked to a dam |
Which number answers which question
The generating figures need their dates attached. About 18 GW was the capacity reported around the 2006 completion. Later comparisons use 22.5 GW of installed capacity. These figures describe the plant's rated ability to generate electricity, rather than how much it produces continuously.
Each measure answers a different question. Reservoir volume helps describe the water stored for flood control. Generating capacity indicates how much power the plant can supply under suitable conditions. The relocation count shows the scale of the social disruption. Like measuring a building by its height, floor area, or occupants, these figures cannot substitute for one another.
A dam also changes more than the power supply. Water held in the reservoir carries sediment that might otherwise travel downstream, and the land beneath the reservoir becomes part of the project's social cost. Those effects belong in the same accounting as electricity: the headline capacity alone cannot show what the system stores, what it alters, or who bears the consequences.
Why China Built It and How Long It Took
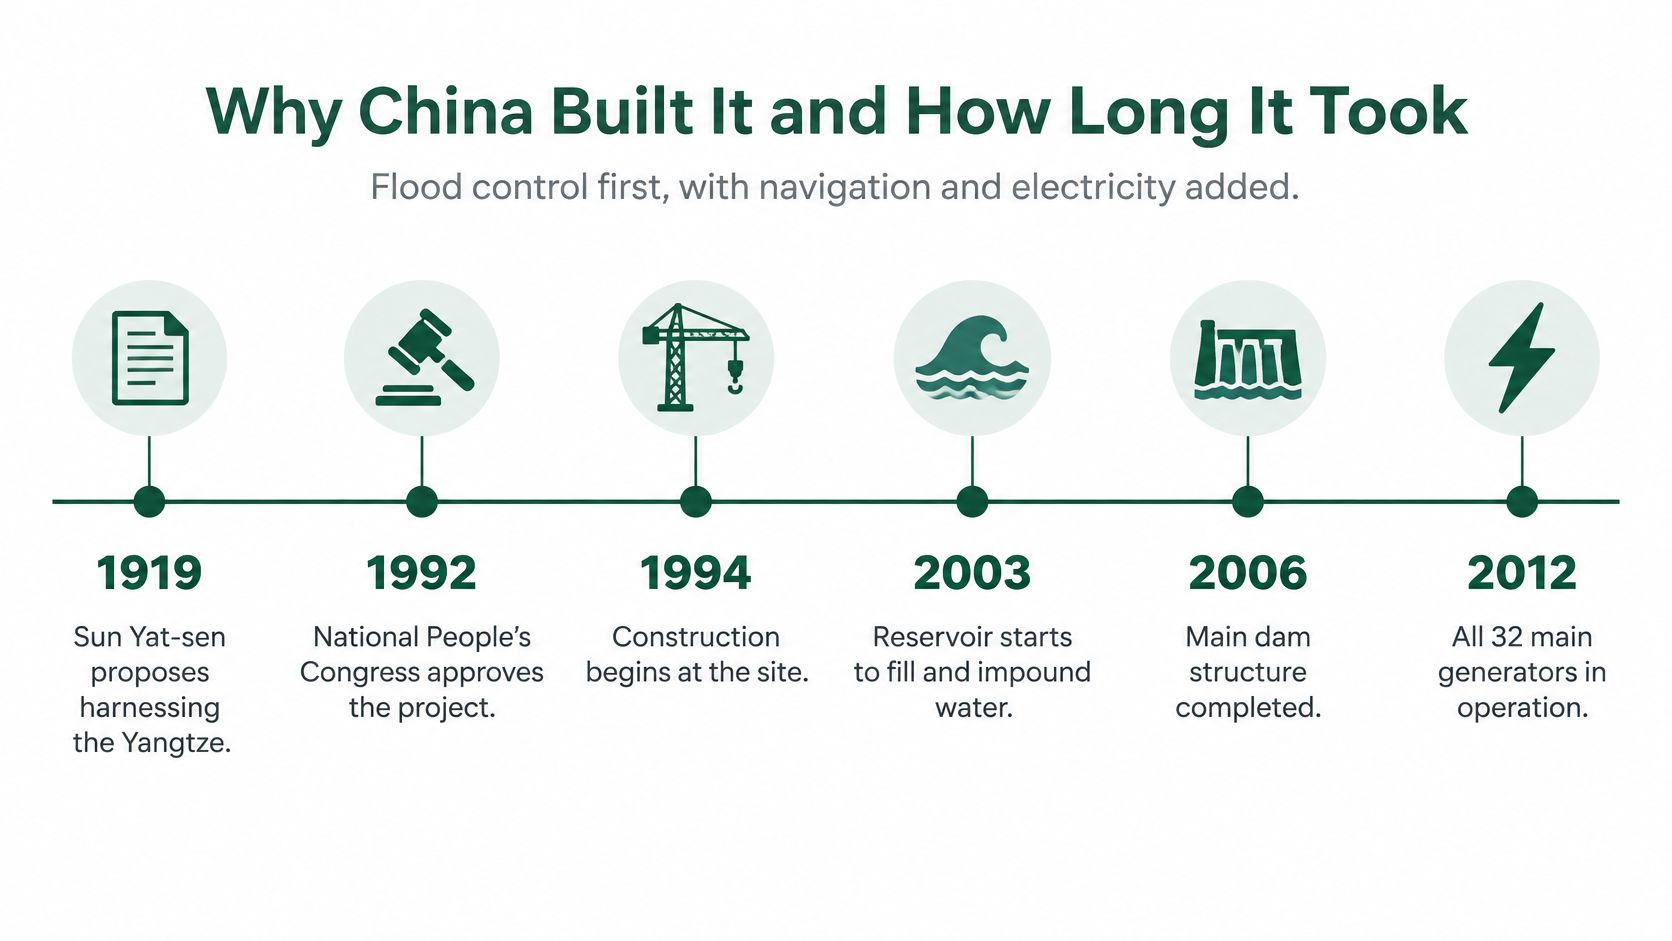
Floods on the Yangtze were the original case for a dam. Inland navigation and electricity were developed beside that case, not instead of it. Britannica's history of the Three Gorges Dam shows a staged programme, not a single pouring of concrete, with the locks designed so vessels of up to 10,000 tonnes could reach inland commercial centres.
A programme, not a single pour
Chinese Nationalist leaders discussed the idea in the 1920s. Mao Zedong renewed interest in feasibility studies in 1953, and detailed planning began in 1955. Governments then argued for roughly 40 years over engineering feasibility, financing, environmental impacts and population relocation before they committed to building. That pause matters. The dam was not a surprise project. It was a plan that had already been fought over for decades when the first access road went in.
Construction activity began in 1993 with access roads and electricity infrastructure. In 1997 the Yangtze was blocked and diverted, which closed the first major construction phase. 2003 is the year the scheme started to work in pieces. The reservoir began filling, the five-tier ship-lock system entered preliminary operation, and the first generator was connected to the grid. The main dam wall was completed in 2006.
Think of a tower block handed over floor by floor. Residents move into the lower floors, and the lifts start running, while the upper structure is still unfinished. Power and shipping began before the wall was complete because the programme was built that way.
Flood control, navigation and generation were developed in parallel across more than a decade of construction. If you only remember 2006, you miss why arguments about relocation and ecology were already old by the time the first unit synchronised.
How One Dam Balances Flood, Shipping and Power
Picture a household tank with three demands on the same water. It must stay low enough to catch a storm, high enough to float a boat, and it must drain steadily through a tap that earns its keep. No setting satisfies all three at the same moment. The Three Gorges Dam is that tank, with a river instead of a loft.
Three jobs, one pool
Flood control comes first in the wet season. Operators hold water in the reservoir so the peak arriving from upstream is smaller when it leaves toward the middle river. They release later, when downstream channels can take the flow. A full reservoir is a poor flood store. Empty space is the product, and empty space is water you have chosen not to run through a turbine today.
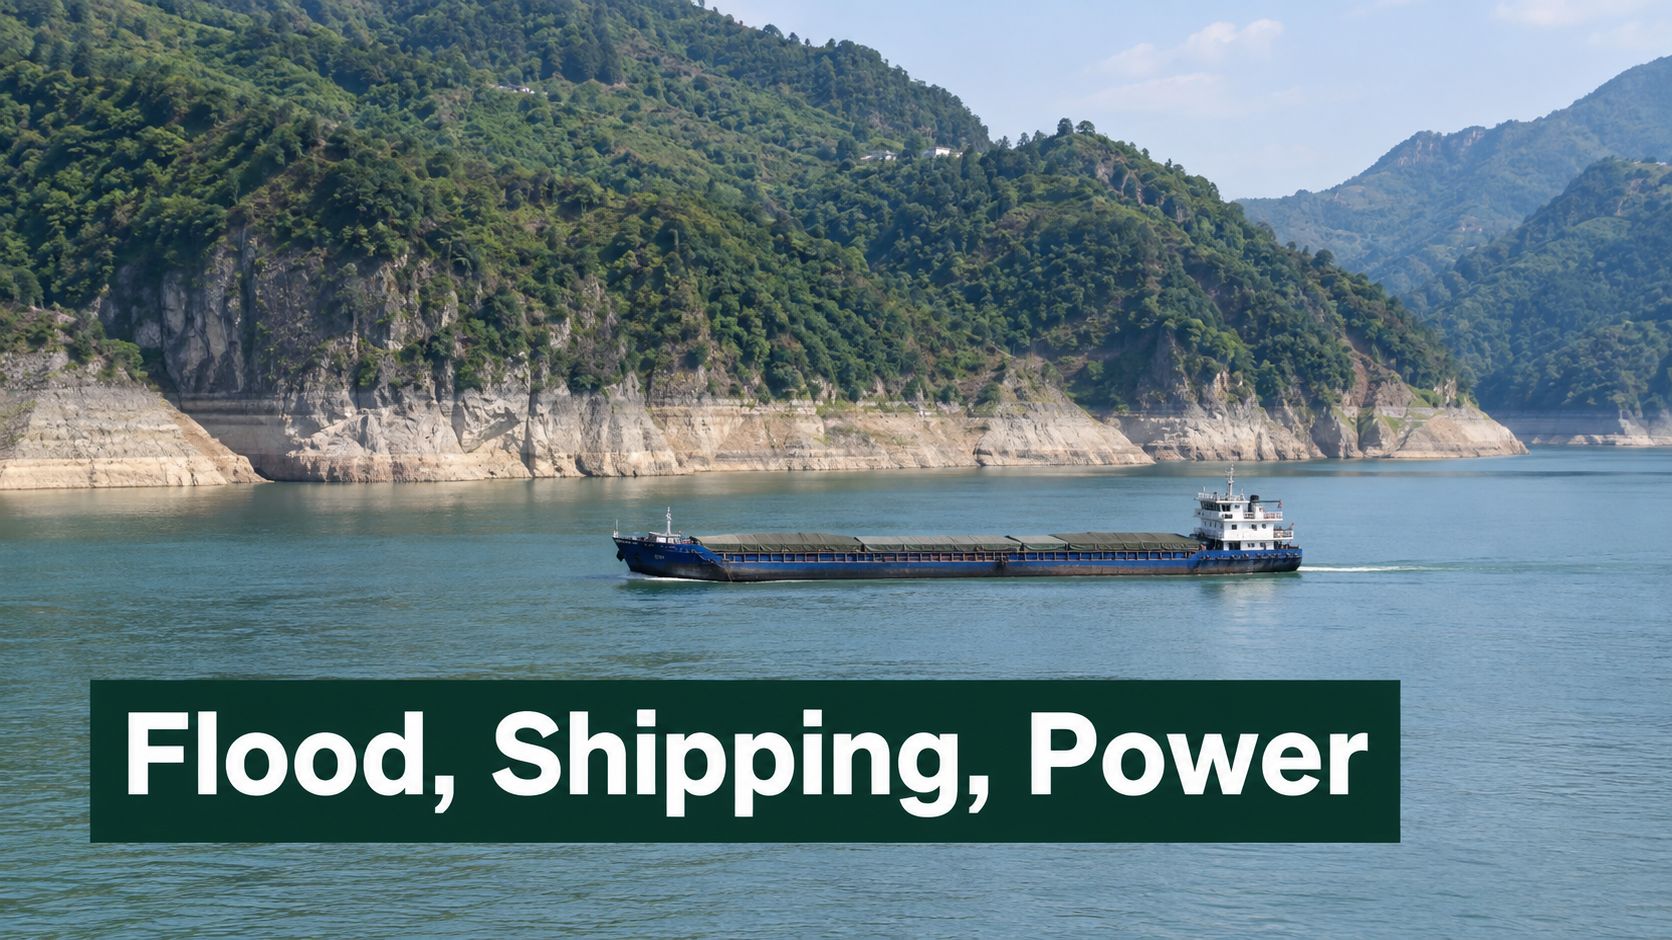
Navigation needs a different level. The five-tier ship lock lifts vessels through a steep change in height in stages, like a staircase rather than a single jump. Large inland ships use that stairway to reach commercial centres that a free-flowing gorge would not serve in the same way. The Huangpi District government report states that the ship locks handled 154 million tonnes of cargo in 2024. That is a freight system, not a side entrance for tourists.
Power is the third tap. Water that passes the turbines makes electricity, but only on the hours when a release also suits flood storage and a navigable pool. Water kept back for the next storm cannot be sold as this afternoon's peak. Water dumped quickly to protect a city may arrive when the grid does not need it.
A short tour of the site makes the split easier to see than a single capacity number does.
Operators balance competing goals. They do not maximise any one of them. That is the core trade-off, and it shows up again the moment you compare nameplate capacity with the electricity that leaves the plant in practice.
How Much Power the Dam Really Delivers
In 2023, the Three Gorges Project generated 80,271 GWh, or about 80.3 TWh. That is the electricity it delivered over the year, a different measure from the plant's maximum generating rate. Capacity is like a car's top speed; annual output is the distance it covers in a week.
The project's installed capacity is roughly 22.5 GW. At that rate, running continuously for a year would produce about 197 TWh. That is a theoretical ceiling, not a forecast: water levels, operating decisions and other demands on the reservoir affect how much electricity the turbines can generate. The UK Digest of UK Energy Statistics for 2026 reports UK electricity demand of 323 TWh and generation of 293.6 TWh in 2025, useful benchmarks for judging the scale.
| Measure | Value | What it tells you |
|---|---|---|
| Installed generating capacity | 22.5 GW | Peak output if every turbine ran flat out |
| Theoretical annual output at full capacity | About 197 TWh | A ceiling, not typical delivered output |
| Actual electricity generated in 2023 | 80,271 GWh | Electricity delivered over the year |
| Implied capacity factor | About 41% | Actual output as a share of the theoretical ceiling |
| UK electricity demand in 2025 | 323 TWh | National demand benchmark |
| UK electricity generation in 2025 | 293.6 TWh | National supply benchmark |
Why the gap is so wide
China Yangtze Power's 2023 announcement records the project's 80,271 GWh of generation in 2023. That is about a quarter of UK electricity demand in 2025. Because the figures cover different years, the comparison shows scale rather than matching supply and demand in the same period.
Dividing actual output by the theoretical ceiling gives an implied capacity factor of about 41%. In plain terms, the project generated about 41% of what it could have produced if it ran at full capacity throughout the year. That gap does not, on its own, mean the plant is faulty. Reservoir inflows vary, and electricity generation shares the stored water with other purposes. Water may be held for flood control or released to support navigation instead of being saved for a time when the grid most needs power.
Practical rule: Compare dams and storage assets using annual delivered energy, capacity factor, firm capacity, storage duration and their role in balancing the grid. Nameplate capacity alone can make a multipurpose reservoir look more productive than its actual electricity output.
The same distinction matters when assessing climate benefits. The amount of coal generation displaced depends on how much electricity the dam really supplies, not on its maximum capacity. Construction and resettlement emissions also affect the comparison. For UK pumped storage and flexible low-carbon plants, models should account for competing demands on reservoir water. A reservoir tasked with flood management will not operate like a battery dedicated to responding to the grid.
The Resettlement of More Than a Million People
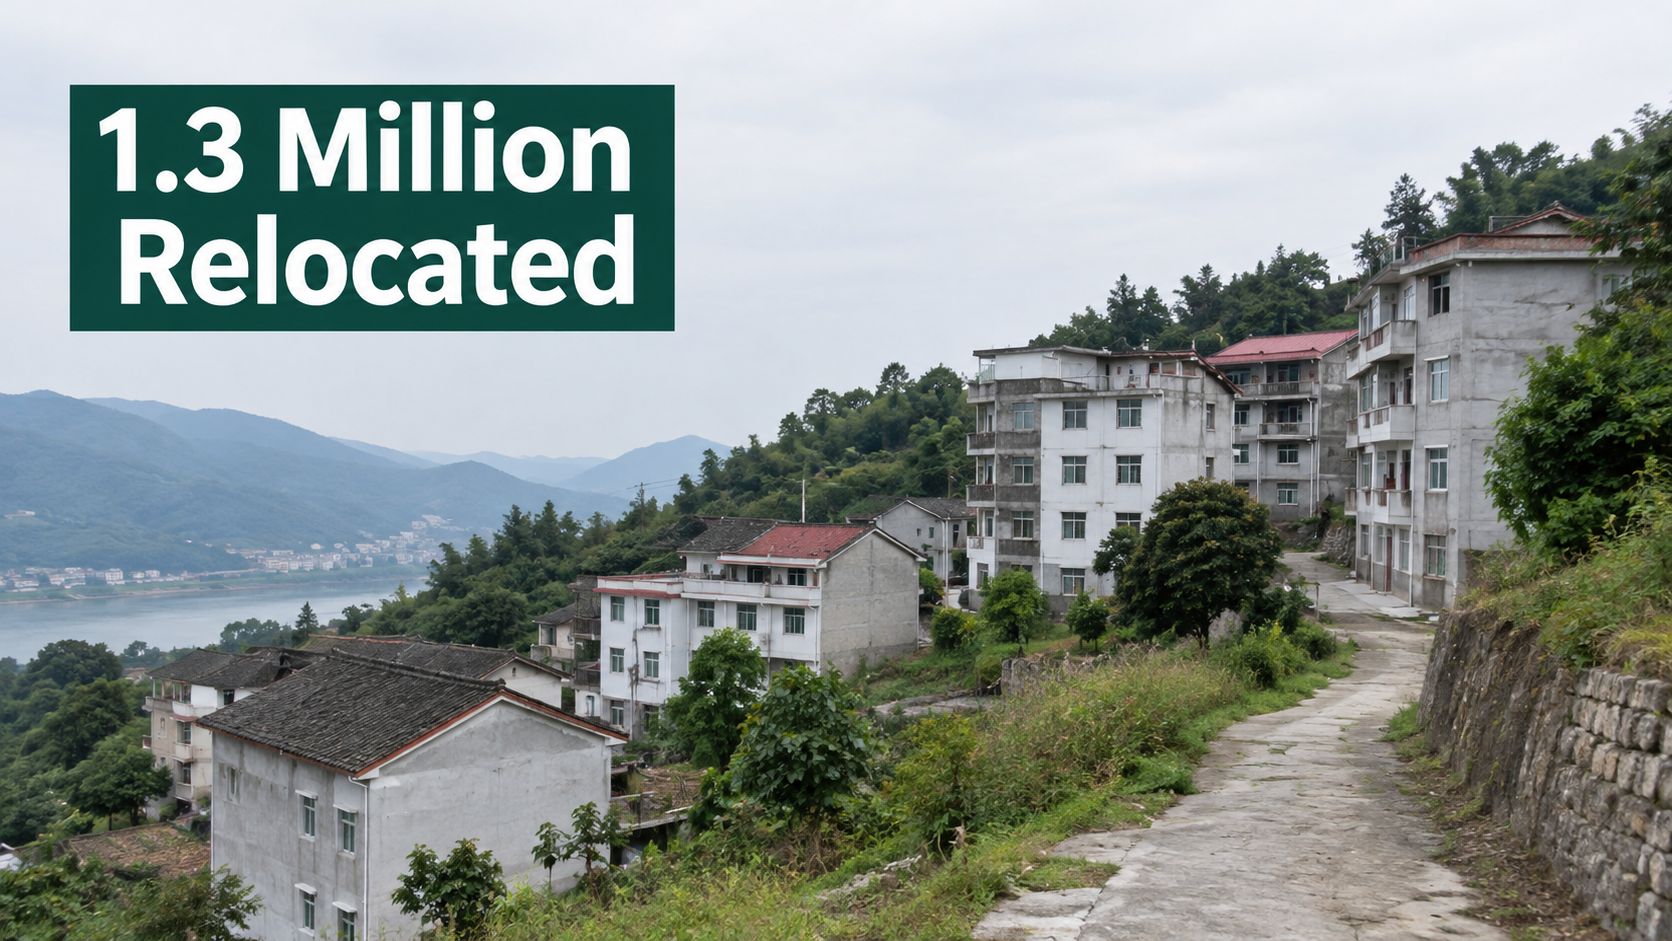
More than 1.3 million people were relocated for the reservoir and related works. Concrete residential buildings situated on a hillside overlooking a river near the Three Gorges Dam project. The scale is easier to grasp by looking beyond buildings: a reservoir can replace homes, farmland and town streets, while uprooting the networks that supported daily life.
What a move actually removes
Consider a family that farms a strip of riverside land, sells vegetables at a town market and fishes when the season allows. When the reservoir covers the fields and lower streets, the family may receive a house on higher ground or move into a city flat. The new home can replace the old structure, but the market, neighbours and knowledge of that particular riverbank do not travel with them.
A home is only one part of a livelihood. Work, schools, kinship and local trade are its supporting beams. Compensation can pay for a building, yet it cannot automatically recreate income tied to land and water that have disappeared. That difference helps explain why counting houses rebuilt does not, by itself, show whether resettlement restored people's lives.
Two readings of the same move
The official case presents relocation as a cost of flood control and regional development, accompanied by compensation and new housing. Critics point to uneven compensation, limited consultation and incomes that may take longer to recover than buildings. These accounts can describe different households in the same county, rather than cancel each other out.
Longitudinal research on development-induced resettlement follows how communities and livelihoods change over years, not just during the move. Outcomes vary with household circumstances and whether the new location supports work. A tidy hillside estate may provide shelter while leaving residents far from jobs or familiar networks.
When judging a resettlement plan, look beyond the number of replacement homes:
- Income later: Household earnings several years after relocation, not just the payment received on moving day.
- Social ties: Whether neighbours, schools and local trade took shape again, rather than housing alone.
- A real say: Whether residents could influence where and when they moved.
Together, these checks show whether a plan accounts for people as well as buildings. If income, social ties and residents' choices are left out, the plan measures concrete while missing much of the social cost.
Sediment, Fish and Groundwater Losses Downstream
A river carries sediment as well as water. The Three Gorges Dam interrupts that movement: research published in Scientific Reports estimates that the reservoir traps about 182 million tonnes of sediment each year, roughly 80% of what flows into it. Water released downstream carries less sediment and can pick up material from the riverbed and banks. Clearer water can therefore erode the channel.
From a trapped load to a scoured channel
Between 2003 and 2017, downstream sediment transport fell by 67.8 to 92.7% compared with the 1955 to 2002 period before the dam began operating. Measured cumulative erosion in flood channels reached about 2.278 billion cubic metres. As finer particles settle in the reservoir, coarser material makes up a larger share of what remains. Farther downstream, the riverbed and banks can be scoured and reshaped. The effects vary along the river, so one gauge cannot describe the whole system.
Sediment, fish habitat and groundwater are connected to the same altered flow, but they measure different effects. A preprint on river and groundwater exchange below the dam found that regulation reduced exchange between the Yangtze and groundwater by 19.3% during the flooding season and 41.8% during the dry period, with the strongest effect in upstream parts of the downstream wetland system. A 2025 study of dam-induced drawdown reported the carp, spawning and hatching habitat changes shown below.
| Effect | Measured change or value | Where it matters |
|---|---|---|
| Sediment trapped by the reservoir | About 182 million tonnes a year | About 80% of sediment entering the reservoir |
| Downstream sediment transport, 2003 to 2017 | Down 67.8 to 92.7% | Compared with 1955 to 2002 |
| Flood-channel erosion downstream | About 2.278 billion m³ | Cumulative measured erosion |
| Carp and crucian carp incubation habitat | Down 39.5% | Suitable habitat after drawdown |
| Total weighted usable spawning habitat | Down 34.3% | Fish spawning capacity |
| Suitable hatching area | About 65.7% of spawning area | Share of spawning area that suits hatching |
| River-groundwater exchange, flood season | Down 19.3% | Strongest in upstream wetland sections |
| River-groundwater exchange, dry period | Down 41.8% | Strongest in upstream wetland sections |
A steadier river is not automatically healthier
Reduced flood variability can weaken river-groundwater exchange, which replenishes groundwater and helps remove pollutants. New monitoring profiles have quantified downstream groundwater responses that were previously poorly understood. That earlier lack of measurement leaves uncertainty; it does not show that the aquifer was unaffected.
Assess a large dam as a sediment and water system, not only as a power asset. Track whether sediment continues downstream, how the riverbed changes, where banks erode, and what those changes mean for habitat. A habitat plan that ignores sediment is like judging a river's health by its water alone.
Economic and Geopolitical Stakes Beyond the Grid
The Three Gorges Dam is often described as either a renewable-energy success or an ecological disaster. Its wider stakes are harder to judge: freight, flood protection and regional development bring benefits, while changes to river flows affect habitats and communities. These outcomes do not fit neatly onto one scale.
On the economic side, reservoir storage and improved navigation can shift freight to inland waterways. A 2025 study reported through the Transportation Research International Documentation record found that this shift reduced industrial carbon emissions by an average of 6.40% in the area studied, mainly because river transport was more efficient. That is a measured carbon benefit from freight movement, not a full account of the dam's emissions or environmental costs.
A field study published in Scientific Reports found that dam-induced drawdown reduced highly suitable incubation habitat for carp and crucian carp by 39.5%, cut total weighted usable spawning habitat by 34.3%, and left suitable hatching area at about 65.7% of suitable spawning area. These figures describe habitat effects, not a carbon measure. The trade-off is real, but the units cannot be subtracted from one another.
What the carbon figure does not cover
Handle the 6.40% figure as an average within the study area. It reflects a shift in freight transport, not a national emissions inventory, and does not capture whole-life carbon, including construction and emissions associated with resettlement. Avoided diesel from moving freight by barge counts as a benefit. It is only one part of the account.
The stakes also reach beyond transport and electricity. Flood protection for cities on the middle Yangtze, regional development, energy supply and national prestige all shape the decision. Countries considering large hydropower projects study China's dam-building practice, so operating rules can influence choices beyond the river itself.
Should transport-related avoided emissions be credited against habitat loss, altered flows and disrupted fish reproduction? The answer depends on the accounting boundary. A fair comparison states what is counted on each side instead of treating unlike outcomes as interchangeable.
A method that does not pretend the units match
Assess each outcome on its own, then compare them within the same boundary. Whole-life carbon accounting can track emissions, while biodiversity measures can describe habitat gains or losses. UK appraisal uses tools such as whole-life carbon accounting, biodiversity net gain and river restoration to frame these questions for smaller schemes.
Climate benefits do not restore a spawning ground, and a spawning ground does not prevent a flood. Decision-makers need to show the trade-offs with clear measures, rather than relying on a single label such as “clean” or “damaging.”
Check These Risks Before Backing a Similar Dam
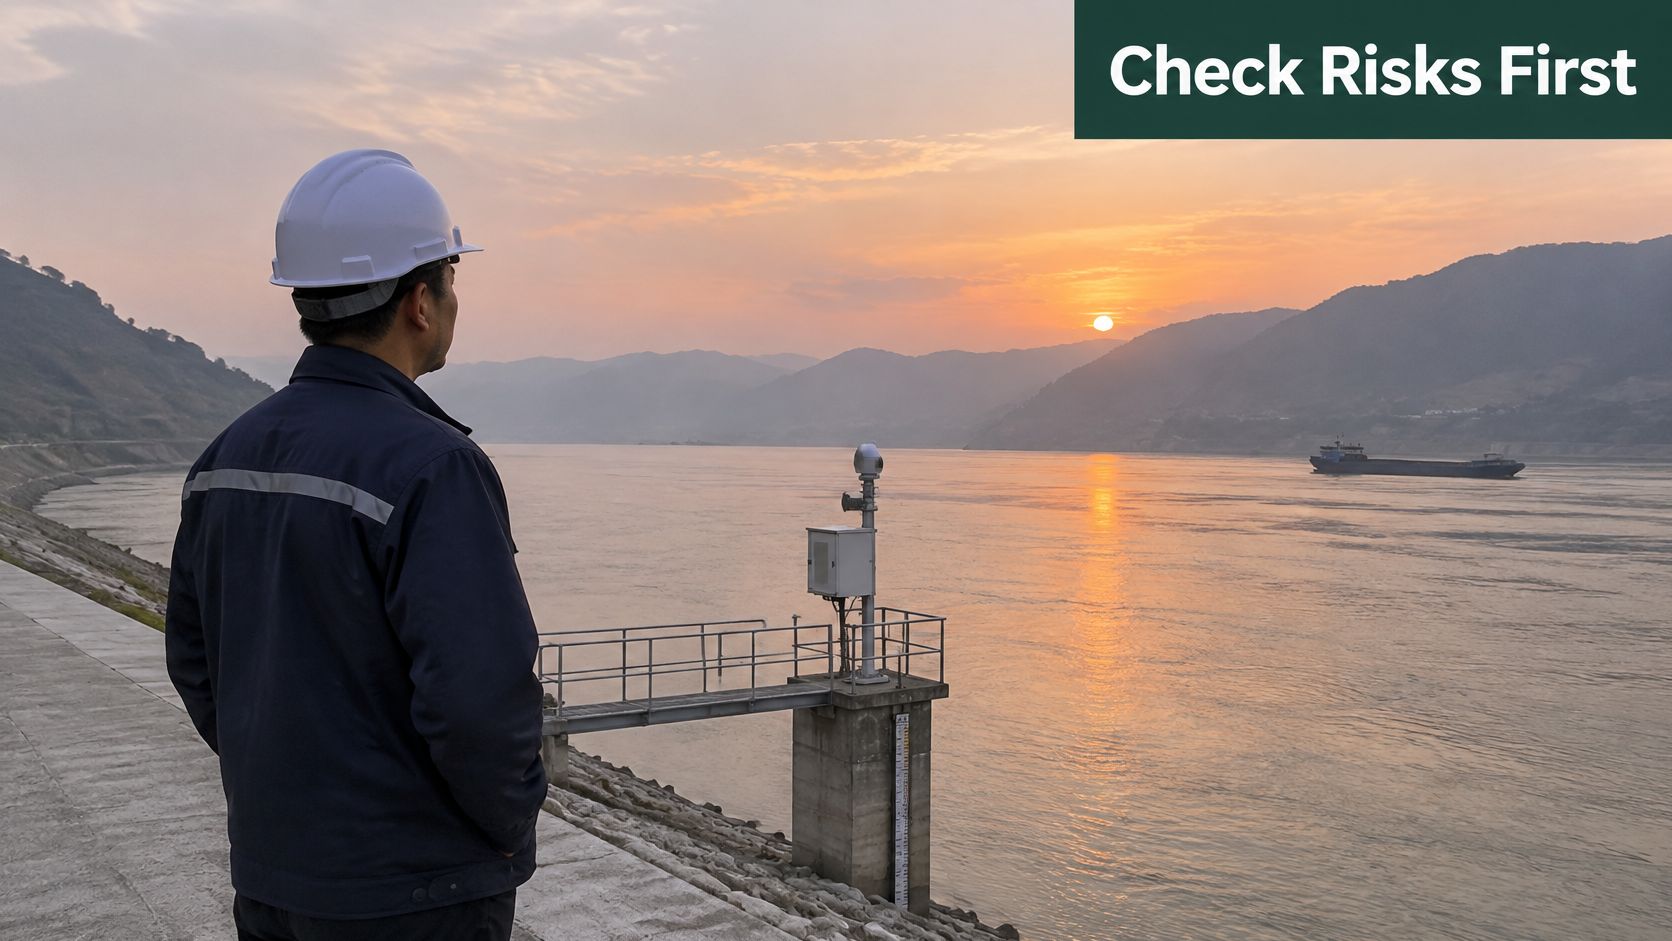
The Three Gorges Project is operating. The reservoir is managed for flood control, shipping and power, and monitoring continues. Status is not the same as a clean bill of health. The risks that showed up here are the ones to test before anyone calls the next large dam a success or a disaster.
| Risk | Mitigation measure | Indicator to track |
|---|---|---|
| Sediment starvation and bank erosion | Sediment-continuity planning and bed-level monitoring | Annual bed level change and bank retreat |
| Spawning habitat loss for fish | Timed releases and habitat restoration | Suitable spawning and hatching area |
| River-groundwater disconnection | Monitoring river-aquifer exchange and protecting wetlands | Seasonal exchange rates in flood and dry periods |
| Hardship after resettlement | Income support and longitudinal social tracking | Household income and social ties over five years |
| Conflicting operating objectives | Explicit rules for water shared between flood, navigation and power | Share of water held for each objective |
The three risks that decide the verdict
Sediment starvation needs a continuity plan and bed-level monitoring, or the channel will be redesigned by the river after you have signed off the drawings. Fish losses need releases timed to spawning and real habitat restoration, tracked as suitable spawning and hatching area, not as a press count of fry released. Resettlement needs income and social ties followed for years. A housewarming is not an outcome.
Add a fourth that sits across the others. Conflicting objectives need written rules for how water is split between flood storage, navigation and power. If that split lives only in an operator's judgement, every dry year becomes a political argument.
Five questions for any proposal
When someone calls a dam a renewable success or an ecological disaster, ask:
- Delivered energy: What is the annual output, not only the installed capacity?
- Sediment and flow: Which changes in mud and water level are measured in practice?
- Species and aquifers: Which fish and which groundwater exchanges are affected, by season?
- People moved: Who was relocated, and how did income and social ties look years later?
- Carbon boundary: Which emissions are inside the claim, and which were left outside?
Those questions map onto UK river-basin work as well. Resilience of the basin, drought planning and biodiversity net gain all fail if you score only the megawatts. Treat any large dam proposal as a sediment, water and social system before you accept either verdict, and take the five questions into the appraisal of the scheme in front of you.
If you are weighing the resource side of a UK operation, from mixed commercial waste to harder industrial streams, Gegan designs compliant, data-led waste and recycling systems that cut volumes, cost and carbon. The same habit of measuring what a system delivers, rather than what it is rated to do, is how they run collections, reporting and diversion for multi-site businesses. See how that works at Gegan.