Causal Loop Diagram Guide for Waste Systems
Learn what a causal loop diagram shows, how to draw reinforcing and balancing loops, and how UK waste teams test them with real data.
In this article
- What a Causal Loop Diagram Actually Shows
- The Five Marks You Need
- Why a Single KPI Misleads
- Reinforcing Loops and Balancing Loops
- The Polarity Rule
- Snowball and Thermostat
- How to Draw a Causal Loop Diagram
- The Six Steps
- A Warning About Scale
- Waste Loops in a Circular Economy
- Two Loops You Can Copy
- Why One Recycling Rate Hides the Problem
- Monthly Variables That Make It Real
- Carbon Delays in a Waste Loop
- The Landfill Chain
- Stocks, Not Instant Flows
- How to Test Whether the Loop Is Real
- Owner, Unit and Rhythm
- Set the Threshold Before You Intervene
- Start With One Site and One Loop
You've added bins, refreshed the signs and sent the reminder email. The recycling figure still doesn't move. That usually means the problem isn't a missing bin. Contamination, rejected loads, cost and staff habits are pushing on each other in a circle, and a straight-line action plan can't show you where.
That's what a causal loop diagram is for. It's a way to draw that circle, challenge it and turn it into numbers you can check each month.
What a Causal Loop Diagram Actually Shows
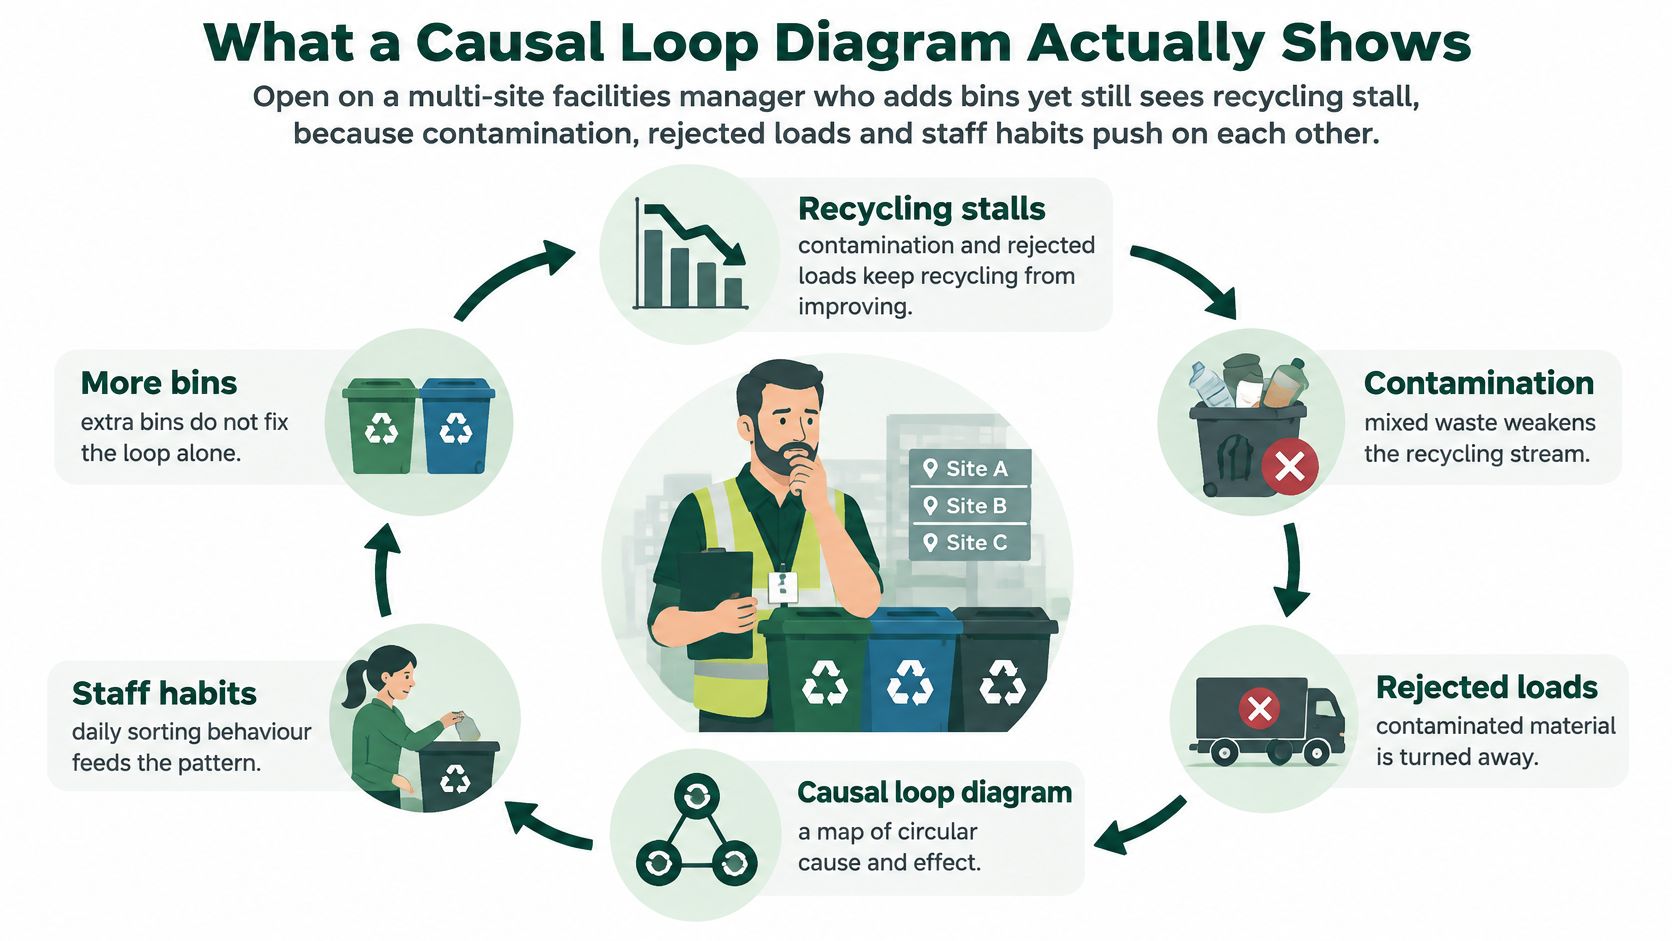
Say you're a facilities manager across six sites. You add dry mixed recycling bins at the worst performer and recycling stalls anyway. Staff are rushed, food goes in the wrong bin, the load is rejected and sent as residual waste, and the extra cost eats the budget for training that might've fixed the sorting in the first place.
A causal loop diagram makes that tangle visible. It's a visual hypothesis about cause and effect over time. It isn't a process flowchart with a start and an end, and it isn't a finished computer model. It's a claim, drawn so other people can test it.
The picture below shows the stalled-recycling pattern before we name any marks.
The Five Marks You Need
You only need five marks to read a diagram. A plus sign means two variables move the same way. A minus sign means they move in opposite ways.
R labels a reinforcing loop that amplifies change. B labels a balancing loop that resists change or pulls toward a target. Two short bars across an arrow mark a delay.
| Mark | Meaning | Waste example |
|---|---|---|
| + | Variables move in the same direction | More training raises the share of material segregated correctly |
| − | Variables move in opposite directions | Higher contamination lowers the tonnage of accepted recyclate |
| R | Reinforcing loop that amplifies change | Cleaner material raises value, which funds more training and cleaner material again |
| B | Balancing loop that resists change or seeks a target | Rejected loads raise disposal cost, which tightens controls and cuts contamination |
| || | Delay between cause and effect | Less biodegradable waste landfilled reduces methane in a later reporting period |
Why a Single KPI Misleads
This way of working has moved out of universities and into practical policy. The 2022 GOV.UK case-study collection on systems thinking for civil servants records workshops with government officials, academics and third-sector organisations where participants realised the performance of individual organisational "silos" depended on the actions of other silos.
The same collection covers a causal loop map for electric-vehicle rollout and the net zero transition, maps for interdependencies affecting child and adolescent wellbeing, and workshops on how universities operate. That's the shift from academic system dynamics modelling to an accessible policy engagement and diagnostic tool.
If you can't say whether an arrow is same-direction, opposite-direction or delayed, you don't have a link yet. You have a guess.
For a waste programme, that discipline stops you judging one site, one stream or one month in isolation. The diagram asks what else moves when your chosen variable moves, and what comes back round to bite you later.
Reinforcing Loops and Balancing Loops
A loop is a chain of arrows that closes back on itself. Whether it's reinforcing or balancing doesn't depend on whether the story sounds hopeful. It depends on a count.
The Polarity Rule
Trace the loop once and count the minus signs. An even number, including zero, makes it reinforcing. An odd number makes it balancing.
That's the whole test. Don't label a loop R because you like the outcome, and don't label it B because it mentions a cost. Count first, label second.
| Loop | Polarity rule | What happens over time | Waste pattern |
|---|---|---|---|
| Reinforcing improvement | Even number of minus signs | A small gain grows if nothing interrupts it | Cleaner segregation funds better kit and training, which cleans the stream further |
| Reinforcing decline | Even number of minus signs | A small loss deepens | Hidden contamination cuts commodity value, training stops, and contamination rises |
| Balancing | Odd number of minus signs | Change is pulled back toward a goal or limit | Rejected loads raise cost, controls tighten, and contamination falls back |
| Weak balancing goal | Odd number of minus signs, but the target is low | The system stabilises in a poor place | The site only aims to stop rejections, so capture never improves |
Snowball and Thermostat
A reinforcing loop works like a snowball. A small push gathers more material as it rolls, whether it's rolling in a direction you want or one you don't.
In waste, a good snowball runs like this. Better segregation produces higher-quality recyclate. Cleaner material earns greater commodity value and gives managers operational confidence to invest in containers, training and measurement, which improves segregation again.
The same loop runs downhill. Contamination nobody spots cuts the value of the load. The site drops refresher training because the return looks poor, sorting gets worse, and contamination rises further. Nobody decided to fail. The loop did the work.
A balancing loop works like a thermostat. It senses a gap from a target and pushes back. When contamination causes rejected recycling loads, the site carries higher residual volumes and disposal costs. That pain triggers stronger controls, clearer signage and targeted coaching, and contamination falls.
Watch the target: a balancing loop can stabilise poor performance just as reliably as good performance.
If the site's real goal is only "don't get loads rejected," controls will relax as soon as rejections stop. Capture of good material may never rise, because nothing in the loop asks for it. The system isn't broken. It's balancing around a weak goal.
You'll see the same trap in wider environmental systems, where several pressures reinforce each other before anyone notices the pattern, as explored in work on the causes of desertification. The lesson transfers directly. Name the goal the loop is serving, not the one on the poster.
Before you go further, practise on one loop from your own site. Trace it, count the minus signs, and write R or B only after that count.
How to Draw a Causal Loop Diagram
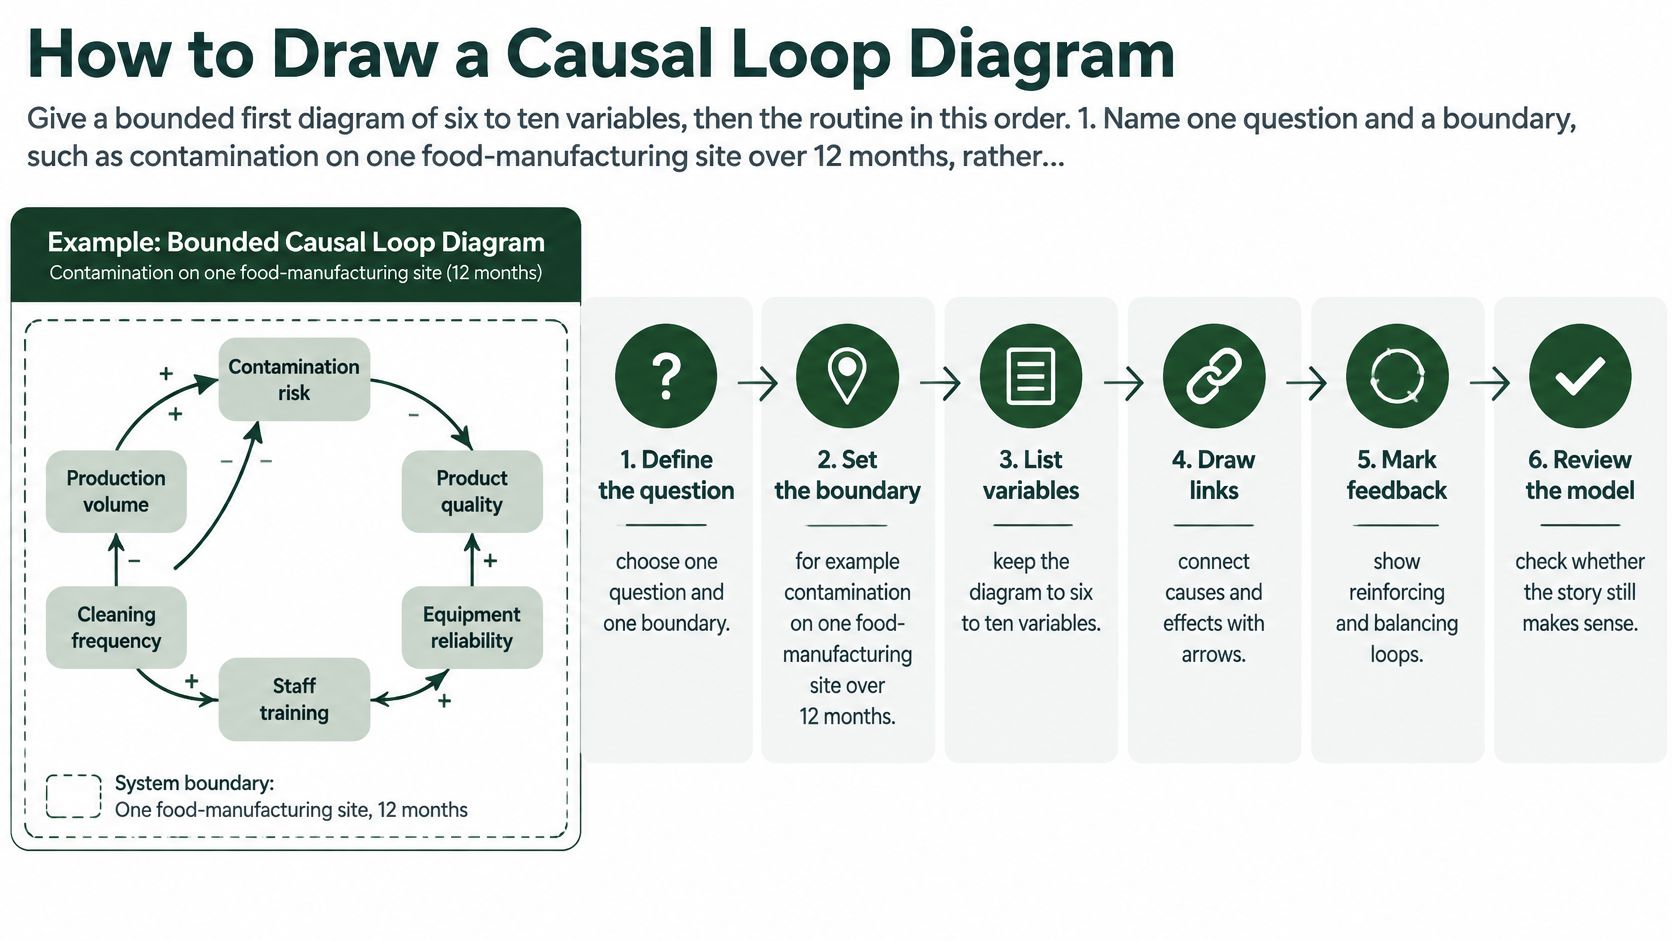
On a food manufacturing site, contamination can stay high even after new signs go up. A causal loop diagram helps the team trace the links behind that result, then decide what to measure. Start with six to ten variables, fit the diagram on one page, and focus on one site question. You can add arrows later; removing confusion is harder.
The infographic below shows a six-step process. Use it to frame the workshop, then work through the steps.
The Six Steps
Name one question and set a boundary. For example: “Why does contamination stay high on this food manufacturing site over 12 months?” “Sustainability” is too broad: it has no clear edge, so almost anything could qualify. The boundary states what the diagram leaves out.
List measurable variables as nouns. Use contamination rate, rejected-load percentage, residual kilograms, training hours and commodity value per tonne. Avoid phrases such as “improving awareness”. They describe an action or idea, not something the team can put a number against next month.
Draw and explain one link at a time. Mark each arrow with a plus or minus, then write a few words explaining the connection. If the group cannot say why one variable affects another, park that link. A crowded diagram of unexplained arrows is difficult to test.
Close each loop and label it. Count the minus signs before marking a loop R or B. A story can feel obvious before it has been checked, so do the count rather than relying on instinct.
Mark delays. Contract prices, reported carbon and behaviour after training may change later than the actions that influence them. Show the delay on the diagram. That helps the team avoid calling a change a failure, or a success, too soon.
Read the loops aloud with the people who affect them. Ask the supervisor, cleaner and person who signs the waste transfer notes to check the links. Remove any connection they cannot explain from their own work. Then write each loop as a sentence a supervisor can challenge, such as “cleaner segregation raises load value, which funds training, which improves segregation further.” A sentence nobody could disagree with is too vague to test.
A video walkthrough shows the drawing mechanics for groups who find it easier to learn by watching.
A Warning About Scale
Workshops and interviews can create much larger diagrams than a site needs to manage. The Scotland-based health and social care study held on Strathprints drew on 24 stakeholder interviews in South Lanarkshire between February and June 2023. A separate UK study involving four schools also produced a large, multi-factor diagram.
These examples show why stakeholders can help build and check a diagram. For a waste operation, though, more detail is not always more useful. If no one can keep the map up to date each month, it risks becoming wall decoration.
Finish with a one-page sketch, named variables, labelled loops and at least one delay. Treat it as a hypothesis, then compare its predictions with site measures such as contamination, rejected loads, residual kilograms and load value. If those numbers do not move as the loop suggests, revise the diagram.
Waste Loops in a Circular Economy
A circular economy only works if material keeps its value as it moves round. That makes a waste system a natural fit for loop thinking, because today's sorting quality decides tomorrow's revenue, training budget and confidence.
Two Loops You Can Copy
The reinforcing loop starts with better material segregation. Cleaner sorting produces higher-quality recyclate, which brings greater commodity value and operational confidence. Managers then invest in containers, training and measurement, and segregation improves again.
The balancing loop starts in the opposite place. Contamination leads to rejected recycling loads, which pushes up residual waste volumes and disposal costs. The site responds with stronger controls, clearer signage and targeted staff interventions, and contamination falls back.
Notice what's missing from both stories. Collection frequency on its own does very little. Collecting a contaminated bin twice as often just moves the same problem faster and usually costs more. The live feedback sits between visible performance data, frontline behaviour and the economic value of clean streams.
Why One Recycling Rate Hides the Problem
Official figures show why a single bubble labelled "recycling rate" will mislead you. The UK statistics on waste published on GOV.UK report 26.2 million tonnes of waste from households arose in 2024 and the UK household waste recycling rate was 44.5%, while packaging recycling was higher at 73.2%.
Those are calibration points, not site targets. Household waste and commercial waste move through different routes, with business material largely handled by private operators. Pasting a household rate onto a factory or hotel as if it were the same series will set you up to chase the wrong number.
| Indicator | 2024 UK figure | Variable to keep separate |
|---|---|---|
| Household waste arisings | 26.2 million tonnes | Total material arising, not a rate |
| Household waste recycling rate | 44.5% | Overall capture, which can hide stream failures |
| Packaging recycling rate | 73.2% | Packaging performance, distinct from household waste |
| Paper and cardboard packaging | 84.1% | Material-specific yield |
| Glass packaging | 79.1% | Material-specific yield |
| Steel packaging | 85.5% | Material-specific yield |
Look at the spread inside packaging alone. Paper and cardboard, glass and steel each perform differently, so an average hides which stream is leaking. Your diagram needs separate variables for total arisings, capture rate, contamination rate and material-specific yield.
A site can raise its headline recycling rate while one valuable stream quietly gets worse. Only separate variables will show you.
Monthly Variables That Make It Real
Turn the sketch into a working tool with site-level data you review every month. Track these five and you'll cover both loops.
- Kilograms per employee or occupied room: shows whether total arisings are really falling or the site is just quieter.
- Percentage of material correctly segregated: measures frontline sorting, not just what left the yard.
- Rejected-load percentage: tells you when contamination has become a commercial problem.
- Collection frequency: lets you test whether extra lifts add value or only cost.
- Net cost per tonne: connects material quality to money, which is what funds the next round of training.
Carbon Delays in a Waste Loop
Carbon is where managers most often misread their own diagram. You change the operation this month, the reported emissions move later, and the gap between the two invites a wrong conclusion.
The Landfill Chain
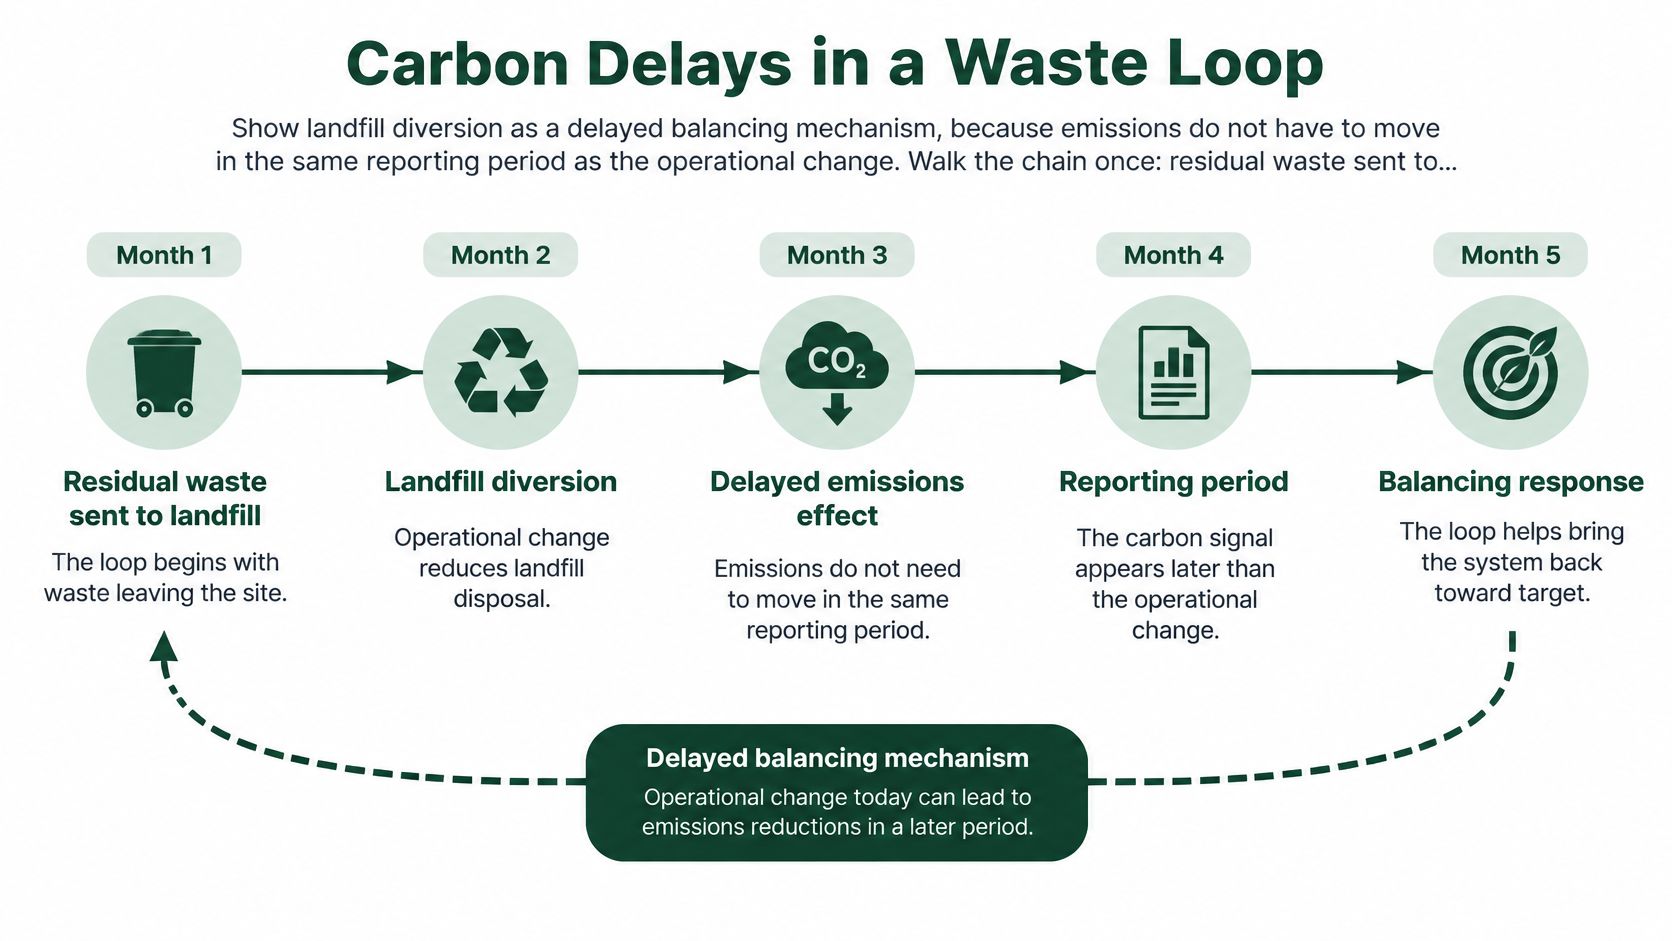
Walk the chain once. Residual waste sent to landfill generates methane emissions as biodegradable material breaks down. That creates carbon impact pressure and ESG scrutiny, which prompts investment in source segregation, food waste separation, reuse and alternative treatment. Over time, less biodegradable material is landfilled.
That's a balancing mechanism, but a slow one. Emissions reductions don't have to appear in the same reporting period as the operational change that caused them.
The timeline below separates the operational change from the carbon signal so your group can see the delay.
The 2024 final greenhouse gas emissions statistics release gives the scale, reporting that in 2024 waste accounted for approximately 6% of UK greenhouse gas emissions, methane represented 77% of waste-sector emissions and landfill accounted for 55% of total waste-sector emissions. Waste-sector emissions also fell by 4% between 2023 and 2024, largely because landfill emissions declined.
Stocks, Not Instant Flows
Three items in this loop must be drawn as stocks that build up and drain slowly, not as instant flows. They are biodegradable residual stock, landfill tonnage and methane emissions.
Treating them as instant makes your diagram promise results it can't deliver. A stock explains why good work this quarter can coexist with stubborn reported emissions.
Pair your indicators to match. Use leading indicators you can see monthly, namely food waste capture, residual kilograms per site, collection contamination and landfill tonnage. Keep estimated carbon dioxide equivalent as the lagging indicator you review over a longer window.
Be careful with a short-term fall in reported emissions. It isn't proof of a permanent system change if waste generation and segregation behaviour haven't shifted. The stock may be draining while the inflow stays the same.
Marking rule: if the effect can't show up before the next reporting period, the arrow gets a delay bar and that variable isn't your same-month success measure.
How to Test Whether the Loop Is Real
A diagram is a set of claims wearing a tidy layout. Testing it means giving every claim a number, an owner and a date by which you'd expect to see movement.
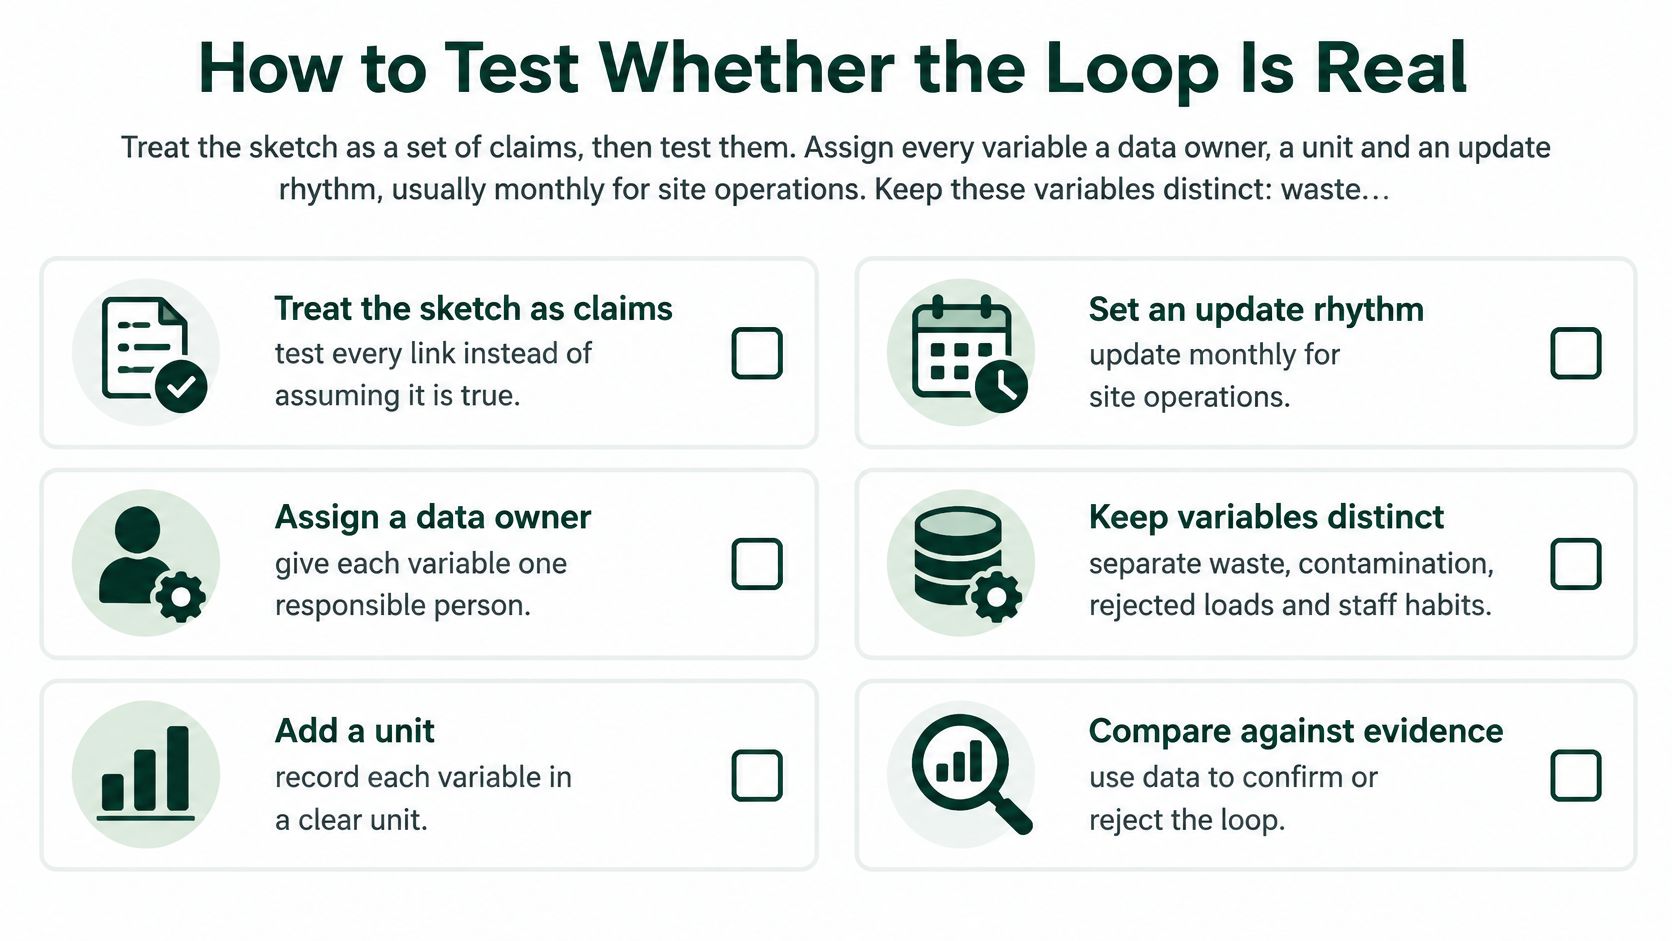
Use the checklist below as your validation pass before you change anything on site.
Owner, Unit and Rhythm
Assign every variable three things. Give it a data owner, a unit and an update rhythm, usually monthly for site operations. A variable with no owner won't be updated when the owner is on leave, which is often when performance slips.
Keep these variables distinct and don't collapse them into one outcome. You need waste arisings, contamination, collection frequency, treatment route, recycling yield, cost, carbon and compliance risk as separate measures.
That separation matters because of how UK figures are gathered. The local authority collected waste statistics recycling explainer for 2024/25 sits within a system where local authority data is collected through WasteDataFlow and excludes much privately managed business waste, while commercial and industrial waste is largely managed through private-sector operators. Your business diagram therefore needs its own weighbridge, rejection and cost records. This is the same discipline behind learning to define quantitative research properly, because a claim you can't measure is only an opinion.
Set the Threshold Before You Intervene
Pick one test in advance. You might require a fall in rejected-load percentage over three collection cycles, or a rise in correctly segregated kilograms without a matching rise in residual waste.
That second condition guards against category shifting. If residual waste falls only because material moved into a contaminated mixed bin, the system hasn't improved. It's relabelled the problem.
A passed test means the leading indicator moved the way your loop predicted and the loop sentence still holds. A failed test means you redraw the link. You don't defend the workshop picture.
Check for the drawing failures that make a test impossible in the first place.
- Verbs used as variables: "training staff" can't be graphed, while training hours can.
- Polarity guessed from a hopeful story: the minus count decides, not the mood in the room.
- No boundary: everything connects to everything, so nothing can be falsified.
- Missing delays: you judge a slow stock on a fast timetable.
- Links nobody on site can explain: the people doing the work can't challenge them.
- No owner for the number: the series stops and the loop goes untested.
Start With One Site and One Loop
Pick one site, one reinforcing loop and one balancing loop. Ignore every other arrow for 90 days. That constraint feels uncomfortable, and it's why the exercise works.
Name a data owner and record the baseline for contamination, rejected loads, residual kilograms and net cost per tonne. Review those four numbers monthly against the sentences on your diagram, the same way you'd reconcile accounts against a chart of accounts rather than trusting a summary line.
If the predicted variable doesn't move, change the link or the intervention. Don't add more variables to explain away a result you don't like.
Tools stay simple. Use a shared whiteboard for the first workshop, then a basic diagramming canvas to keep labels consistent. Keep the actual monthly series in a spreadsheet or customer portal, where it can be audited.
Where you lack reliable weights, rejection records or end destination evidence, a single accountable waste partner is the practical next step. Reported movements such as lower cost, less general waste, more recycling and lower carbon are the kind of results a diagram should explain. The drawing itself creates none of them.
One site, two loops, one owner, one monthly review. That's enough to find out whether your loop is real.
If your sites can't yet produce the weights, rejection records and end destination evidence needed to test a causal loop diagram, Gegan can run your multi-site waste and recycling programme through one accountable partner, with a portal giving you service updates, waste metrics and downloadable reports. Bring us one site and one stubborn loop, and we'll help you build the auditable monthly numbers that show whether segregation, cost and carbon are moving.